
Search results
Create the page "Gdp/capita" on this wiki! See also the search results found.
- GDP: non-EU and US regions, non-OECD cities GDP per capita: regions, cities GDP PPP per capita: regions, cities GDP growth rate: regions, cities GDP by...20 KB (135 words) - 16:27, 30 May 2015
- 319 million in 2014 GDP: $16.8 billion in 2013 GDP Per Capita: $53,042 nominal ($53,042 PPP) in 2013 GDP Growth Rate: 2.4% in 2014 GDP by industry in 2013...14 KB (976 words) - 17:12, 30 May 2015
- European countries by Press Freedom Index, 2021 Flora and Fauna of Bavaria GDP per capita of UAE, Saudi Arabia, Oman, Turkey "Absence makes the heart grow fonder...1 KB (78 words) - 13:28, 9 August 2023
- count, percentage internet users, percentage mobile subscriptions, GDP per capita. Input files have different formats (some csv, some json) and different...11 KB (605 words) - 20:21, 19 April 2023
- (PPP)|{{{GDP_PPP_rank}}}]]) |- | style="padding: 0 1em 0.4em 0; text-align:left; vertical-align: top;" | - Per capita || {{{GDP_PPP_per_capita}}} ([[List...13 KB (1,712 words) - 01:10, 16 August 2006
- criteria should not be just the GDP. The GDP is important. I think it's one of the criteria should use GDP per capita, maybe with be some refinement,...110 KB (19,706 words) - 01:42, 18 March 2021
- 2. GDP by region: GDP by region, GDP per capita by region, Population by region This section depicts the structure of an economy by showing GDP broken...14 KB (1,815 words) - 03:18, 17 September 2021
- study performance relative to traffic and percentage of global GDP and per capita GDP Toby: is the goal to raise maximum money, or least annoyance? Damon...14 KB (1,820 words) - 13:37, 13 August 2020
- four national languages of Switzerland. Our statistics (donation/capita, donation/GDP, and the number of people who chose to give to WM CH vs WMF in 2010...7 KB (1,254 words) - 19:11, 25 March 2012
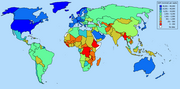
 GDP per capita, purchasing power parity, figures for 2004. Using wikipedia's world map and information from wikipedia's article w:List of countries by...(1,788 × 881 (40 KB)) - 07:58, 5 April 2024
- According the CIA World Factbook, Burundi is ranked 191th (3rd to last) for GDP per Capita. An ethnic civil war from 1993 to 2006 killed 300,000 Burundians. Approximately...14 KB (1,881 words) - 19:25, 24 April 2023
 U.S. states by GDP per capita (nominal) from U.S. states by GDP per capita (nominal) English...(945 × 583 (25 KB)) - 20:38, 16 October 2021
 over 10000 GDP per capita. 2007-05-05 21:47 Brainboy109 1357×714× (56609 bytes) == Summary == {{Information| |Description = GDP (PPP) per capita. Using wikipedia's...(1,357 × 714 (50 KB)) - 10:53, 12 September 2020
- CAGR of 26 percent. Devices and connections per capita, average speeds, and average traffic per capita per month are all expected to rise globally. Mobile...33 KB (3,182 words) - 16:53, 18 February 2024
 1350×625×8 (33856 bytes) == Summary == {{Information |Description = GDP (nominal) per capita. Using [[User:Vardion|Vardion]]'s blank world map and information...(2,250 × 1,117 (176 KB)) - 19:43, 8 October 2020
 Source : GDP (per capita) (most recent) by country English URL: https://commons.wikimedia.org/wiki/user:Urban author name string: Urban Wikimedia username:...(480 × 335 (74 KB)) - 06:51, 27 February 2023
 names refer to en.wikipedia. 2006-01-08 05:25 JavOs 362×466× (11669 bytes) Exponential Pattern in GDP per capita distribution (as of May 2005) English...(362 × 466 (11 KB)) - 08:02, 28 August 2023
 a derivative work of the following images: File:Brazilian_States_by_GDP_per_capita_2006.svg licensed with Cc-by-sa-2.5,2.0,1.0, Cc-by-sa-3.0-migrated,...(780 × 687 (638 KB)) - 16:24, 18 December 2023
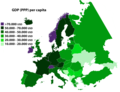 Created by me. Map of European GDP per capita PPP (purchasing power parity). Source: World Bank, 2021 English...(2,560 × 1,957 (568 KB)) - 15:57, 15 April 2023
 Source:https://theodora.com/wfb/1990/rankings/gdp_per_capita_1.html English URL: https://commons.wikimedia.org/wiki/user:Emilfaro author name string: Emilfaro...(952 × 565 (38 KB)) - 08:08, 1 December 2023
 (45864 bytes) Data Source: Angus Maddison's "World Population, GDP and Per Capita GDP, 1-2003 AD" at The Groningen Growth and Development Centre. http://www...(941 × 742 (13 KB)) - 06:51, 27 February 2023
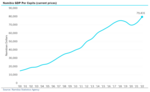 work, hereby publish it under the following license: English Namibia GDP per capita - Cirrus author name string: NamibianUpdates Wikimedia username: NamibianUpdates...(1,134 × 699 (41 KB)) - 07:39, 15 November 2023
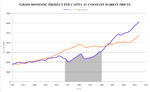 license: This image is a derivative work of the following images: File:GDP_per_capita_LA-Chile.png licensed with PD-self 2009-04-26T04:18:14Z Cantus 1449x885...(1,449 × 885 (63 KB)) - 06:53, 27 February 2023
 https://creativecommons.org/publicdomain/mark/1.0/PDMCreative Commons Public Domain Mark 1.0falsefalse English Relationship bewteen Marriage Rate and GDP per capita...(620 × 368 (63 KB)) - 05:54, 23 December 2022
 this work, hereby publish it under the following license: English GDP (PPP) Per Capita Around the World 2023, Source: IMF author name string: LandAndTree...(1,920 × 1,080 (326 KB)) - 00:15, 15 February 2024
 19:47 Mrgomel 605×433× (9605 bytes) Infant deaths per 1000 births (2007) vs GDP per capita (PPP) (2006). Data source: CIA World Factbook 2007 English...(605 × 433 (9 KB)) - 06:50, 8 April 2024
 English A graph of the world's Gross Domestic Product (GDP) per capita Chinese 全世界的人均国民收入(GDP)统计图 author name string: Rossenne Wikimedia username: Rossenne...(1,350 × 625 (49 KB)) - 07:37, 7 October 2020
 (engels: GDP) in beeld te brengen op een kaart |Source=Eigen media, o.b.v [http://nl.wikibooks.org/wiki/Afbeelding:European-Union-GDP-per-capita-map.png...(538 × 422 (21 KB)) - 07:15, 15 September 2020
 your use. https://creativecommons.org/licenses/by/4.0CC BY 4.0 Creative Commons Attribution 4.0 truetrue English GDP per capita of Botswana, 1950 to 2016...(3,400 × 2,400 (454 KB)) - 11:55, 17 December 2023
 Autocorrelation function of annual growth in real US GDP per capita 1790-2021 [first differences of log(GDP per capita)] author name string: DavidMCEddy Wikimedia...(504 × 504 (22 KB)) - 10:23, 15 December 2023
 African states by GDP per capita in 2002. Numbers in USD and from the World Bank. English determination method: SHA-1...(360 × 392 (9 KB)) - 15:51, 23 July 2023
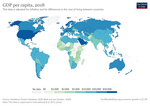 https://creativecommons.org/licenses/by-sa/4.0CC BY-SA 4.0 Creative Commons Attribution-Share Alike 4.0 truetrue English Global map showing per capita GDP in 2018....(3,400 × 2,400 (791 KB)) - 17:28, 23 April 2024
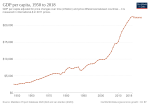 https://creativecommons.org/licenses/by-sa/3.0CC BY-SA 3.0 Creative Commons Attribution-Share Alike 3.0 truetrue English GDP per capita development Panama...(850 × 600 (31 KB)) - 22:04, 15 February 2022
 https://creativecommons.org/licenses/by-sa/3.0CC BY-SA 3.0 Creative Commons Attribution-Share Alike 3.0 truetrue English GDP per capita development in Colombia...(850 × 600 (39 KB)) - 22:03, 15 February 2022
- CAGR of 26 percent. Devices and connections per capita, average speeds, and average traffic per capita per month are all expected to rise globally. Mobile...33 KB (3,182 words) - 16:55, 18 February 2024
- CAGR of 26 percent. Devices and connections per capita, average speeds, and average traffic per capita per month are all expected to rise globally. Mobile...29 KB (3,182 words) - 16:55, 18 February 2024
- CAGR of 26 percent. Devices and connections per capita, average speeds, and average traffic per capita per month are all expected to rise globally. Mobile...35 KB (3,185 words) - 16:55, 18 February 2024
 your use. https://creativecommons.org/licenses/by/4.0CC BY 4.0 Creative Commons Attribution 4.0 truetrue English Real GDP per capita development of Niger...(850 × 600 (31 KB)) - 17:27, 23 April 2024
 https://creativecommons.org/licenses/by-sa/3.0CC BY-SA 3.0 Creative Commons Attribution-Share Alike 3.0 truetrue English GDP per capita development in Switzerland...(1,051 × 654 (43 KB)) - 15:02, 14 February 2022
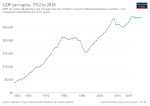 https://creativecommons.org/licenses/by-sa/3.0CC BY-SA 3.0 Creative Commons Attribution-Share Alike 3.0 truetrue English GDP per capita development in Slovenia...(850 × 600 (31 KB)) - 22:06, 15 February 2022
 https://creativecommons.org/licenses/by-sa/3.0CC BY-SA 3.0 Creative Commons Attribution-Share Alike 3.0 truetrue English GDP per capita development of Chad...(850 × 600 (31 KB)) - 00:36, 26 February 2022
 https://creativecommons.org/licenses/by-sa/3.0CC BY-SA 3.0 Creative Commons Attribution-Share Alike 3.0 truetrue English GDP per capita development of Iran...(850 × 600 (32 KB)) - 20:32, 26 February 2023
 https://creativecommons.org/licenses/by-sa/3.0CC BY-SA 3.0 Creative Commons Attribution-Share Alike 3.0 truetrue English GDP per capita development of Benin...(850 × 600 (31 KB)) - 00:37, 26 February 2022
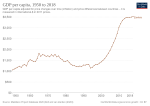 https://creativecommons.org/licenses/by-sa/3.0CC BY-SA 3.0 Creative Commons Attribution-Share Alike 3.0 truetrue English GDP per capita development of Zambia...(850 × 600 (31 KB)) - 00:36, 26 February 2022
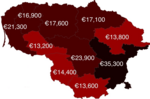 use. https://creativecommons.org/licenses/by/4.0CC BY 4.0 Creative Commons Attribution 4.0 truetrue English Lithuanian counties by GDP per capita, 2022...(1,128 × 741 (149 KB)) - 21:47, 18 February 2024
 BY-SA 4.0 Creative Commons Attribution-Share Alike 4.0 truetrue English GDP per capita by year (USD) Armenian Մեկ շնչին բաժին ընկնող ՀՆԱ-Ն ըստ տարիների (ԱՄՆ...(512 × 365 (104 KB)) - 07:53, 8 August 2023
 https://creativecommons.org/licenses/by-sa/3.0CC BY-SA 3.0 Creative Commons Attribution-Share Alike 3.0 truetrue English GDP per capita development of Tunisia...(850 × 600 (31 KB)) - 20:48, 9 January 2024
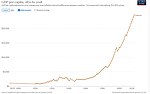 https://creativecommons.org/licenses/by-sa/3.0CC BY-SA 3.0 Creative Commons Attribution-Share Alike 3.0 truetrue English GDP per capita development in Malaysia...(1,031 × 648 (42 KB)) - 15:02, 14 February 2022
 https://creativecommons.org/licenses/by-sa/3.0CC BY-SA 3.0 Creative Commons Attribution-Share Alike 3.0 truetrue English GDP per capita development of Egypt...(850 × 600 (31 KB)) - 15:00, 15 February 2022
 https://creativecommons.org/licenses/by-sa/3.0CC BY-SA 3.0 Creative Commons Attribution-Share Alike 3.0 truetrue English GDP per capita development of Rwanda...(1,037 × 646 (39 KB)) - 22:33, 14 February 2022
 BY-SA 4.0 Creative Commons Attribution-Share Alike 4.0 truetrue English GDP per capita East Germany Wikimedia username: Midofe1996 author name string: Midofe1996...(779 × 391 (15 KB)) - 06:53, 27 February 2023
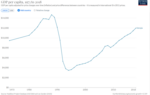 https://creativecommons.org/licenses/by-sa/3.0CC BY-SA 3.0 Creative Commons Attribution-Share Alike 3.0 truetrue English GDP per capita development of Georgia...(1,020 × 645 (38 KB)) - 22:34, 14 February 2022
 https://creativecommons.org/licenses/by-sa/4.0CC BY-SA 4.0 Creative Commons Attribution-Share Alike 4.0 truetrue English GDP per capita development of Mongolia...(850 × 600 (31 KB)) - 16:33, 16 February 2022
 https://creativecommons.org/licenses/by-sa/3.0CC BY-SA 3.0 Creative Commons Attribution-Share Alike 3.0 truetrue English Historic GDP per capita in Peru...(850 × 600 (66 KB)) - 22:04, 15 February 2022
 https://creativecommons.org/licenses/by-sa/3.0CC BY-SA 3.0 Creative Commons Attribution-Share Alike 3.0 truetrue English GDP per capita development of Liberia...(1,049 × 650 (39 KB)) - 22:33, 14 February 2022
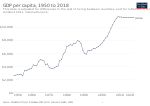 https://creativecommons.org/licenses/by-sa/4.0CC BY-SA 4.0 Creative Commons Attribution-Share Alike 4.0 truetrue English German Real GDP per capita development of Jordan...(850 × 600 (31 KB)) - 17:27, 23 April 2024
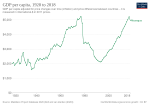 https://creativecommons.org/licenses/by-sa/3.0CC BY-SA 3.0 Creative Commons Attribution-Share Alike 3.0 truetrue English GDP per capita development in Nicaragua...(850 × 600 (34 KB)) - 22:03, 15 February 2022
 https://creativecommons.org/licenses/by-sa/3.0CC BY-SA 3.0 Creative Commons Attribution-Share Alike 3.0 truetrue English GDP per capita development of Chile...(850 × 600 (44 KB)) - 15:00, 25 February 2022
 https://creativecommons.org/licenses/by-sa/4.0CC BY-SA 4.0 Creative Commons Attribution-Share Alike 4.0 truetrue English Real GDP per capita development of Burundi...(850 × 600 (31 KB)) - 17:27, 23 April 2024
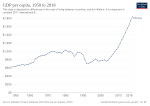 org/licenses/by-sa/4.0CC BY-SA 4.0 Creative Commons Attribution-Share Alike 4.0 truetrue English German Real GDP per capita development of Ethiopia 1950 to 2018...(850 × 600 (32 KB)) - 17:27, 23 April 2024
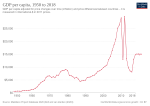 https://creativecommons.org/licenses/by-sa/3.0CC BY-SA 3.0 Creative Commons Attribution-Share Alike 3.0 truetrue English GDP per capita development in Libya...(850 × 600 (31 KB)) - 22:05, 15 February 2022
 https://creativecommons.org/licenses/by-sa/3.0CC BY-SA 3.0 Creative Commons Attribution-Share Alike 3.0 truetrue English GDP per capita development in Vietnam...(850 × 600 (31 KB)) - 22:06, 15 February 2022
 https://creativecommons.org/licenses/by-sa/3.0CC BY-SA 3.0 Creative Commons Attribution-Share Alike 3.0 truetrue English GDP per capita development in Laos...(850 × 600 (31 KB)) - 22:04, 15 February 2022
 https://creativecommons.org/licenses/by/4.0CC BY 4.0 Creative Commons Attribution 4.0 truetrue English Real GDP per capita development of South Africa...(850 × 600 (51 KB)) - 23:32, 16 September 2022
 https://creativecommons.org/licenses/by-sa/3.0CC BY-SA 3.0 Creative Commons Attribution-Share Alike 3.0 truetrue English GDP per capita development in of Belgium...(1,009 × 652 (37 KB)) - 22:34, 14 February 2022
 https://creativecommons.org/licenses/by-sa/4.0CC BY-SA 4.0 Creative Commons Attribution-Share Alike 4.0 truetrue English GDP per capita development in Oman...(850 × 600 (31 KB)) - 16:33, 16 February 2022
 https://creativecommons.org/licenses/by-sa/3.0CC BY-SA 3.0 Creative Commons Attribution-Share Alike 3.0 truetrue English GDP per capita development of Germany...(850 × 600 (40 KB)) - 22:04, 15 February 2022
 https://creativecommons.org/licenses/by-sa/4.0CC BY-SA 4.0 Creative Commons Attribution-Share Alike 4.0 truetrue English GDP per capita development of Nigeria...(850 × 600 (31 KB)) - 12:33, 1 June 2023
 https://creativecommons.org/licenses/by-sa/3.0CC BY-SA 3.0 Creative Commons Attribution-Share Alike 3.0 truetrue English GDP per capita development of Mali...(850 × 600 (32 KB)) - 00:36, 26 February 2022
 https://creativecommons.org/licenses/by-sa/3.0CC BY-SA 3.0 Creative Commons Attribution-Share Alike 3.0 truetrue English GDP per capita development of Gabon...(850 × 600 (32 KB)) - 00:36, 26 February 2022
 https://creativecommons.org/licenses/by-sa/3.0CC BY-SA 3.0 Creative Commons Attribution-Share Alike 3.0 truetrue English GDP per capita development in Tanzania...(850 × 600 (31 KB)) - 20:14, 9 May 2023
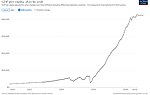 https://creativecommons.org/licenses/by-sa/3.0CC BY-SA 3.0 Creative Commons Attribution-Share Alike 3.0 truetrue English GDP per capita development in Austria...(1,021 × 650 (40 KB)) - 15:02, 14 February 2022
 https://creativecommons.org/licenses/by-sa/4.0CC BY-SA 4.0 Creative Commons Attribution-Share Alike 4.0 truetrue English GDP per capita development in Algeria...(1,025 × 657 (33 KB)) - 02:16, 20 March 2022
 https://creativecommons.org/licenses/by-sa/4.0CC BY-SA 4.0 Creative Commons Attribution-Share Alike 4.0 truetrue English GDP per capita development in Sudan...(850 × 600 (31 KB)) - 16:33, 16 February 2022
 https://creativecommons.org/licenses/by-sa/3.0CC BY-SA 3.0 Creative Commons Attribution-Share Alike 3.0 truetrue English GDP per capita development in Mozambique...(850 × 600 (30 KB)) - 00:33, 26 February 2022
 https://creativecommons.org/licenses/by-sa/3.0CC BY-SA 3.0 Creative Commons Attribution-Share Alike 3.0 truetrue English GDP per capita development of Bosnia...(1,064 × 653 (34 KB)) - 22:34, 14 February 2022
 https://creativecommons.org/licenses/by-sa/3.0CC BY-SA 3.0 Creative Commons Attribution-Share Alike 3.0 truetrue English GDP per capita development in Denmark...(1,033 × 654 (40 KB)) - 15:02, 14 February 2022
 https://creativecommons.org/licenses/by-sa/3.0CC BY-SA 3.0 Creative Commons Attribution-Share Alike 3.0 truetrue English Historic GDP per capita in India...(850 × 600 (39 KB)) - 22:03, 15 February 2022
 https://creativecommons.org/licenses/by-sa/3.0CC BY-SA 3.0 Creative Commons Attribution-Share Alike 3.0 truetrue English GDP per capita development of Argentina...(850 × 600 (38 KB)) - 17:52, 21 December 2022
 use. https://creativecommons.org/licenses/by/3.0CC BY 3.0 Creative Commons Attribution 3.0 truetrue English GDP per capita development in Iran 1950-2018...(850 × 590 (23 KB)) - 17:27, 23 April 2024
 https://creativecommons.org/licenses/by-sa/3.0CC BY-SA 3.0 Creative Commons Attribution-Share Alike 3.0 truetrue English GDP per capita development of Jamaica...(850 × 600 (33 KB)) - 00:37, 26 February 2022
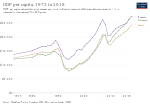 org/licenses/by-sa/3.0CC BY-SA 3.0 Creative Commons Attribution-Share Alike 3.0 truetrue English GDP per capita development of Estonia, Lithuania and Latvia...(850 × 600 (37 KB)) - 07:48, 21 February 2024
 https://creativecommons.org/licenses/by-sa/3.0CC BY-SA 3.0 Creative Commons Attribution-Share Alike 3.0 truetrue English GDP per capita development of Yemen...(850 × 600 (31 KB)) - 22:56, 18 February 2022
 https://creativecommons.org/licenses/by-sa/4.0CC BY-SA 4.0 Creative Commons Attribution-Share Alike 4.0 truetrue English GDP per capita development in Bolivia...(850 × 600 (37 KB)) - 16:33, 16 February 2022
 https://creativecommons.org/licenses/by-sa/3.0CC BY-SA 3.0 Creative Commons Attribution-Share Alike 3.0 truetrue English GDP per capita development of India...(1,029 × 650 (35 KB)) - 22:33, 14 February 2022
 https://creativecommons.org/licenses/by-sa/4.0CC BY-SA 4.0 Creative Commons Attribution-Share Alike 4.0 truetrue English GDP per capita development in Bangladesh...(850 × 600 (32 KB)) - 14:38, 16 February 2022
 https://creativecommons.org/licenses/by-sa/3.0CC BY-SA 3.0 Creative Commons Attribution-Share Alike 3.0 truetrue English GDP per capita development in East Asia...(850 × 600 (51 KB)) - 17:32, 29 March 2023
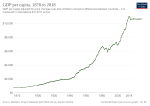 https://creativecommons.org/licenses/by-sa/3.0CC BY-SA 3.0 Creative Commons Attribution-Share Alike 3.0 truetrue English GDP per capita development of Ecuador...(850 × 600 (36 KB)) - 00:37, 26 February 2022
 https://creativecommons.org/licenses/by-sa/3.0CC BY-SA 3.0 Creative Commons Attribution-Share Alike 3.0 truetrue English GDP per capita development in Panama...(1,028 × 650 (41 KB)) - 15:02, 14 February 2022
 Attribution-Share Alike 4.0 truetrue English A map of the UK divided by the average GDP per capita in 2016 (in euros) showing the distribution of economic activity URL:...(567 × 827 (120 KB)) - 20:09, 24 June 2023
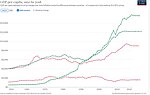 org/licenses/by-sa/4.0CC BY-SA 4.0 Creative Commons Attribution-Share Alike 4.0 truetrue English German GDP per capita development in Southern Africa...(1,019 × 646 (56 KB)) - 16:34, 13 February 2022
 https://creativecommons.org/licenses/by-sa/4.0CC BY-SA 4.0 Creative Commons Attribution-Share Alike 4.0 truetrue English Historical GDP per capita development in Syria...(1,017 × 647 (44 KB)) - 16:38, 13 February 2022
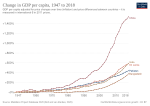 org/licenses/by-sa/4.0CC BY-SA 4.0 Creative Commons Attribution-Share Alike 4.0 truetrue English Change in GDP per capita of India and its neighbours from 1947 to 2018...(850 × 600 (61 KB)) - 06:50, 27 February 2023
 https://creativecommons.org/licenses/by-sa/3.0CC BY-SA 3.0 Creative Commons Attribution-Share Alike 3.0 truetrue English GDP per capita development in Sierra Leone...(850 × 600 (31 KB)) - 22:03, 15 February 2022
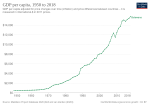 https://creativecommons.org/licenses/by-sa/3.0CC BY-SA 3.0 Creative Commons Attribution-Share Alike 3.0 truetrue English GDP per capita development of Botswana...(850 × 600 (31 KB)) - 00:36, 26 February 2022
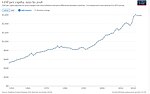 https://creativecommons.org/licenses/by-sa/3.0CC BY-SA 3.0 Creative Commons Attribution-Share Alike 3.0 truetrue English GDP per capita development in Guinea...(1,033 × 649 (44 KB)) - 15:02, 14 February 2022
 https://creativecommons.org/licenses/by-sa/3.0CC BY-SA 3.0 Creative Commons Attribution-Share Alike 3.0 truetrue English GDP per capita development in Italy...(1,035 × 651 (45 KB)) - 15:02, 14 February 2022
 https://creativecommons.org/licenses/by-sa/4.0CC BY-SA 4.0 Creative Commons Attribution-Share Alike 4.0 truetrue English Real GDP per capita development of Cuba...(850 × 600 (37 KB)) - 16:55, 18 August 2022
 https://creativecommons.org/licenses/by-sa/4.0CC BY-SA 4.0 Creative Commons Attribution-Share Alike 4.0 truetrue English Real GDP per capita development in Central Asia...(850 × 600 (46 KB)) - 17:27, 23 April 2024
 org/licenses/by-sa/4.0CC BY-SA 4.0 Creative Commons Attribution-Share Alike 4.0 truetrue English Historical GDP per capita development in Nicaragua...(1,024 × 649 (44 KB)) - 16:38, 13 February 2022
 Was the U.S. GDP Then?[1], MeasuringWorth, (Please provide a date or year), Wikidata Q56881105. English Annual growth in US GDP per capita 1790 to 2021...(504 × 504 (23 KB)) - 08:02, 28 August 2023
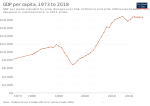 https://creativecommons.org/licenses/by-sa/3.0CC BY-SA 3.0 Creative Commons Attribution-Share Alike 3.0 truetrue English GDP per capita development of Belarus...(850 × 600 (29 KB)) - 22:05, 15 February 2022
 https://creativecommons.org/licenses/by-sa/4.0CC BY-SA 4.0 Creative Commons Attribution-Share Alike 4.0 truetrue English Real GDP per capita development of Greece...(850 × 600 (43 KB)) - 17:27, 23 April 2024
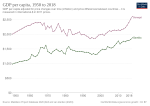 https://creativecommons.org/licenses/by-sa/3.0CC BY-SA 3.0 Creative Commons Attribution-Share Alike 3.0 truetrue English GDP per capita development in Senegal and Gambia...(850 × 600 (38 KB)) - 19:47, 27 February 2022
 https://creativecommons.org/licenses/by-sa/4.0CC BY-SA 4.0 Creative Commons Attribution-Share Alike 4.0 truetrue English GDP per capita development in Mongolia...(1,024 × 652 (42 KB)) - 16:34, 13 February 2022
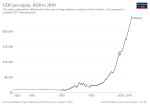 https://creativecommons.org/licenses/by-sa/4.0CC BY-SA 4.0 Creative Commons Attribution-Share Alike 4.0 truetrue English Real GDP per capita development of Malaysia...(850 × 600 (35 KB)) - 23:19, 14 August 2022
 https://creativecommons.org/licenses/by-sa/4.0CC BY-SA 4.0 Creative Commons Attribution-Share Alike 4.0 truetrue English GDP per capita development of Middle Age England...(1,049 × 649 (48 KB)) - 16:34, 13 February 2022
 https://creativecommons.org/licenses/by-sa/4.0CC BY-SA 4.0 Creative Commons Attribution-Share Alike 4.0 truetrue English GDP per capita development development of Ghana...(850 × 600 (31 KB)) - 23:30, 3 June 2023
 org/licenses/by-sa/4.0CC BY-SA 4.0 Creative Commons Attribution-Share Alike 4.0 truetrue English GDP per capita development of Madagascar, 1950 to 2018...(850 × 600 (31 KB)) - 23:32, 16 September 2022
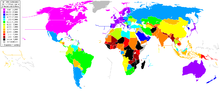 choice. This image is a derivative work of the following images: File:GDP_PPP_per_capita_2007_IMF.png licensed with Cc-by-sa-3.0,2.5,2.0,1.0, GFDL 2009-05-29T02:40:42Z...(1,500 × 630 (70 KB)) - 07:43, 7 October 2020
- country. Historic Grants USD weighted by GDP per capita PPP (33.3%) Annual Grants USD weighted by GDP per capita PPP (33.3%) Historic grants count (16.7%)...9 KB (34 words) - 23:36, 21 June 2023
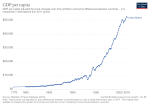 Creative Commons Attribution 4.0 truetrue English Economic Growth in the USA: GDP per capita since 1775 Russian ВВП на душу населения (в ценах 2011 года)...(850 × 600 (29 KB)) - 13:53, 20 February 2024
 https://creativecommons.org/licenses/by-sa/4.0CC BY-SA 4.0 Creative Commons Attribution-Share Alike 4.0 truetrue English GDP per capita development in China and Taiwan...(850 × 600 (43 KB)) - 16:33, 16 February 2022
 https://creativecommons.org/licenses/by-sa/3.0CC BY-SA 3.0 Creative Commons Attribution-Share Alike 3.0 truetrue English Spanish GDP per capita development in Iran...(850 × 600 (32 KB)) - 20:32, 26 February 2023
 https://creativecommons.org/licenses/by-sa/4.0CC BY-SA 4.0 Creative Commons Attribution-Share Alike 4.0 truetrue English GDP per capita development in Turkey...(850 × 600 (27 KB)) - 20:52, 9 January 2024
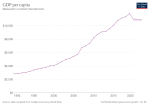 https://creativecommons.org/licenses/by-sa/4.0CC BY-SA 4.0 Creative Commons Attribution-Share Alike 4.0 truetrue English GDP per capita development in Bhutan...(850 × 600 (27 KB)) - 16:33, 16 February 2022
 https://creativecommons.org/licenses/by-sa/3.0CC BY-SA 3.0 Creative Commons Attribution-Share Alike 3.0 truetrue English GDP per capita development in Bahrain...(850 × 600 (32 KB)) - 22:05, 15 February 2022
 https://creativecommons.org/licenses/by-sa/4.0CC BY-SA 4.0 Creative Commons Attribution-Share Alike 4.0 truetrue English Real GDP per capita development of Guinea...(850 × 600 (32 KB)) - 09:58, 23 September 2022
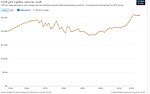 https://creativecommons.org/licenses/by-sa/4.0CC BY-SA 4.0 Creative Commons Attribution-Share Alike 4.0 truetrue English Historical GDP per capita development in Senegal...(1,033 × 648 (40 KB)) - 16:38, 13 February 2022
 https://creativecommons.org/licenses/by-sa/3.0CC BY-SA 3.0 Creative Commons Attribution-Share Alike 3.0 truetrue English GDP per capita development in Thailand...(1,028 × 652 (46 KB)) - 02:49, 23 June 2023
 org/licenses/by-sa/3.0CC BY-SA 3.0 Creative Commons Attribution-Share Alike 3.0 truetrue English GDP per capita development in Southern Africa.svg...(850 × 600 (53 KB)) - 00:34, 26 February 2022
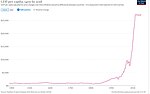 https://creativecommons.org/licenses/by-sa/4.0CC BY-SA 4.0 Creative Commons Attribution-Share Alike 4.0 truetrue English Historical GDP per capita development in Poland...(1,029 × 646 (41 KB)) - 16:38, 13 February 2022
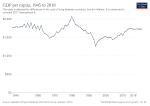 https://creativecommons.org/licenses/by-sa/4.0CC BY-SA 4.0 Creative Commons Attribution-Share Alike 4.0 truetrue English Real GDP per capita develoment of Haiti...(850 × 600 (31 KB)) - 17:27, 23 April 2024
 https://creativecommons.org/licenses/by-sa/4.0CC BY-SA 4.0 Creative Commons Attribution-Share Alike 4.0 truetrue English German Real GDP per capita development of Uganda...(850 × 600 (31 KB)) - 17:27, 23 April 2024
 0CC BY-SA 3.0 Creative Commons Attribution-Share Alike 3.0 truetrue English GDP per capita development in Norway, Iceland, Denmark, Sweden and Finland...(850 × 600 (61 KB)) - 13:01, 26 October 2023
 org/licenses/by-sa/4.0CC BY-SA 4.0 Creative Commons Attribution-Share Alike 4.0 truetrue English GDP per capita development in India, Pakistan and Bangladesh...(850 × 600 (46 KB)) - 16:33, 16 February 2022
 https://creativecommons.org/licenses/by-sa/4.0CC BY-SA 4.0 Creative Commons Attribution-Share Alike 4.0 truetrue English Historical GDP per capita development in Rwanda...(1,014 × 646 (40 KB)) - 16:38, 13 February 2022
 https://creativecommons.org/licenses/by-sa/4.0CC BY-SA 4.0 Creative Commons Attribution-Share Alike 4.0 truetrue English Real GDP per capita development of Moldova...(850 × 600 (28 KB)) - 17:27, 23 April 2024
 org/licenses/by-sa/4.0CC BY-SA 4.0 Creative Commons Attribution-Share Alike 4.0 truetrue English Historical GDP per capita development in Portugal...(1,030 × 647 (41 KB)) - 16:38, 13 February 2022
 https://creativecommons.org/licenses/by-sa/3.0CC BY-SA 3.0 Creative Commons Attribution-Share Alike 3.0 truetrue English GDP per capita development of Sahel countries...(1,014 × 652 (88 KB)) - 22:33, 14 February 2022
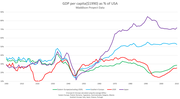 BY-SA 4.0 Creative Commons Attribution-Share Alike 4.0 truetrue English GDP per capita of the Eastern Bloc author name string: Midofe1996 URL: https://commons...(1,109 × 612 (54 KB)) - 08:08, 1 December 2023
 Creative Commons Attribution-Share Alike 4.0 truetrue English IQ vs GDP per capita author name string: Wikideas1 Wikimedia username: Wikideas1 URL: http://commons...(4,837 × 2,135 (705 KB)) - 10:58, 24 August 2023
 https://creativecommons.org/licenses/by-sa/4.0CC BY-SA 4.0 Creative Commons Attribution-Share Alike 4.0 truetrue English Real GDP per capita of development of Bulgaria...(850 × 600 (34 KB)) - 17:28, 23 April 2024
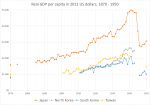 Real GDP per capita in 2011 US dallars in East Asia(Japan, North Korea, South Korea, Taiwan), 1870-1950 Japanese 日本、北朝鮮、韓国、台湾の一人当たり購買力平価で換算したGDP...(953 × 669 (90 KB)) - 02:16, 22 December 2022
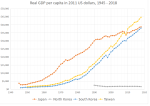 Real GDP per capita in 2011 US dallars in East Asia(Japan, North Korea, South Korea, Taiwan), 1945-2018 Japanese 日本、北朝鮮、韓国、台湾の一人当たり購買力平価で換算したGDP...(953 × 669 (102 KB)) - 02:16, 22 December 2022
 https://creativecommons.org/licenses/by-sa/4.0CC BY-SA 4.0 Creative Commons Attribution-Share Alike 4.0 truetrue English Real GDP per capita development of Uruguay...(850 × 600 (39 KB)) - 17:27, 23 April 2024
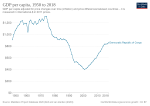 org/licenses/by-sa/4.0CC BY-SA 4.0 Creative Commons Attribution-Share Alike 4.0 truetrue English GDP per capita in the Democratic Republic of Congo...(850 × 600 (31 KB)) - 16:33, 16 February 2022
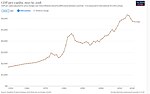 org/licenses/by-sa/3.0CC BY-SA 3.0 Creative Commons Attribution-Share Alike 3.0 truetrue English GDP per capita development in the Republic of Congo...(1,039 × 652 (43 KB)) - 15:02, 14 February 2022
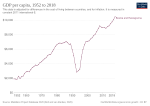 org/licenses/by-sa/4.0CC BY-SA 4.0 Creative Commons Attribution-Share Alike 4.0 truetrue English Real GDP per capita development of Bosnia and Herzegovina...(850 × 600 (31 KB)) - 17:27, 23 April 2024
 https://creativecommons.org/licenses/by-sa/4.0CC BY-SA 4.0 Creative Commons Attribution-Share Alike 4.0 truetrue English Real GDP per capita development of Angola...(850 × 600 (31 KB)) - 22:54, 10 August 2022
 https://creativecommons.org/licenses/by-sa/4.0CC BY-SA 4.0 Creative Commons Attribution-Share Alike 4.0 truetrue English Real GDP per capita development of Syria...(850 × 600 (31 KB)) - 17:27, 23 April 2024
 org/licenses/by-sa/4.0CC BY-SA 4.0 Creative Commons Attribution-Share Alike 4.0 truetrue English Map of Africa by 2020 nominal GDP per capita (USD)...(1,000 × 1,000 (174 KB)) - 10:12, 17 June 2023
 https://creativecommons.org/licenses/by-sa/4.0CC BY-SA 4.0 Creative Commons Attribution-Share Alike 4.0 truetrue English Real GDP per capita development of Morocco...(850 × 600 (32 KB)) - 17:27, 23 April 2024
 org/licenses/by-sa/4.0CC BY-SA 4.0 Creative Commons Attribution-Share Alike 4.0 truetrue English Historical GDP per capita development in Tanzania...(1,022 × 647 (39 KB)) - 16:38, 13 February 2022
 https://creativecommons.org/licenses/by-sa/4.0CC BY-SA 4.0 Creative Commons Attribution-Share Alike 4.0 truetrue English Modern GDP per capita development in Poland...(1,034 × 644 (43 KB)) - 17:02, 13 February 2022
 Gini coefficient beside to GDP per capita (Presented experimentally) Portuguese Coeficiente de Gini ao lado do PIB per capita (Apresentado em forma experimental)...(1,200 × 1,200 (92 KB)) - 02:59, 17 November 2022
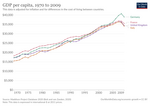 org/licenses/by-sa/4.0CC BY-SA 4.0 Creative Commons Attribution-Share Alike 4.0 truetrue English GDP per capita: Italy, France, Germany, United Kingdom (1970–2009)...(3,400 × 2,400 (475 KB)) - 13:37, 15 October 2023
 https://creativecommons.org/licenses/by-sa/3.0CC BY-SA 3.0 Creative Commons Attribution-Share Alike 3.0 truetrue English GDP per capita development of Burkina Faso...(850 × 600 (31 KB)) - 17:27, 23 April 2024
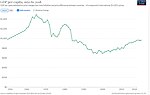 https://creativecommons.org/licenses/by-sa/4.0CC BY-SA 4.0 Creative Commons Attribution-Share Alike 4.0 truetrue English Historical GDP per capita development in Niger...(1,024 × 647 (45 KB)) - 16:38, 13 February 2022
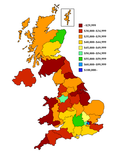 Commons Attribution-Share Alike 4.0 truetrue English United Kingdom GDP per capita by region (2018) author name string: NagNandoor Wikimedia username:...(1,296 × 1,662 (418 KB)) - 20:11, 24 June 2023
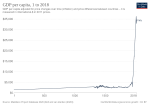 https://creativecommons.org/licenses/by-sa/3.0CC BY-SA 3.0 Creative Commons Attribution-Share Alike 3.0 truetrue English Historical GDP per capita development of Italy...(850 × 600 (50 KB)) - 22:04, 15 February 2022
 org/licenses/by-sa/4.0CC BY-SA 4.0 Creative Commons Attribution-Share Alike 4.0 truetrue English Real GDP per capita development of Czechia, 1950 to 2018...(850 × 600 (29 KB)) - 17:27, 23 April 2024
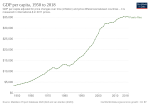 https://creativecommons.org/licenses/by-sa/3.0CC BY-SA 3.0 Creative Commons Attribution-Share Alike 3.0 truetrue English GDP per capita development in Puerto Rico...(850 × 600 (31 KB)) - 00:25, 13 April 2024
 https://creativecommons.org/licenses/by-sa/3.0CC BY-SA 3.0 Creative Commons Attribution-Share Alike 3.0 truetrue English GDP per capita development in Sri Lanka...(1,017 × 650 (41 KB)) - 15:02, 14 February 2022
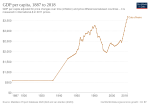 https://creativecommons.org/licenses/by-sa/3.0CC BY-SA 3.0 Creative Commons Attribution-Share Alike 3.0 truetrue English GDP per capita development of Ivory Coast...(850 × 600 (32 KB)) - 17:27, 23 April 2024
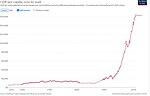 https://creativecommons.org/licenses/by-sa/4.0CC BY-SA 4.0 Creative Commons Attribution-Share Alike 4.0 truetrue English Historical GDP per capita development of Mexico...(1,017 × 649 (42 KB)) - 16:38, 13 February 2022
 https://creativecommons.org/licenses/by-sa/4.0CC BY-SA 4.0 Creative Commons Attribution-Share Alike 4.0 truetrue English GDP per capita development in China 1913 to 1950...(850 × 600 (26 KB)) - 16:33, 16 February 2022
 https://creativecommons.org/licenses/by-sa/4.0CC BY-SA 4.0 Creative Commons Attribution-Share Alike 4.0 truetrue English Baltic regions by GDP per capita...(3,150 × 1,864 (560 KB)) - 12:13, 17 February 2024
 org/licenses/by-sa/3.0CC BY-SA 3.0 Creative Commons Attribution-Share Alike 3.0 truetrue English GDP per capita development in Italy, 1922 to 1943...(1,026 × 649 (32 KB)) - 22:34, 14 February 2022
 org/licenses/by-sa/4.0CC BY-SA 4.0 Creative Commons Attribution-Share Alike 4.0 truetrue English Real GDP per capita development in Europe, 1820 to 2018...(850 × 600 (29 KB)) - 17:27, 23 April 2024
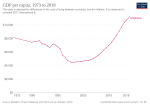 https://creativecommons.org/licenses/by-sa/4.0CC BY-SA 4.0 Creative Commons Attribution-Share Alike 4.0 truetrue English Real GDP per capita development of Uzbekistan...(850 × 600 (28 KB)) - 17:19, 17 August 2022
 org/licenses/by-sa/3.0CC BY-SA 3.0 Creative Commons Attribution-Share Alike 3.0 truetrue English GDP per capita development in Australia and New Zealand...(850 × 600 (58 KB)) - 22:06, 15 February 2022
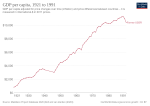 https://creativecommons.org/licenses/by-sa/3.0CC BY-SA 3.0 Creative Commons Attribution-Share Alike 3.0 truetrue English GDP per capita development of the Soviet Union...(850 × 600 (31 KB)) - 17:27, 23 April 2024
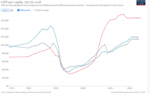 org/licenses/by-sa/3.0CC BY-SA 3.0 Creative Commons Attribution-Share Alike 3.0 truetrue English GDP per capita development of Azerbaijan, Armenia and Georgia...(1,034 × 649 (59 KB)) - 22:33, 14 February 2022
 org/licenses/by-sa/4.0CC BY-SA 4.0 Creative Commons Attribution-Share Alike 4.0 truetrue English GDP per capita development in Haiti and Dominican Republic...(850 × 600 (39 KB)) - 16:33, 16 February 2022
 org/licenses/by-sa/4.0CC BY-SA 4.0 Creative Commons Attribution-Share Alike 4.0 truetrue English GDP per capita development of Japan, 1870 to 1950...(1,021 × 646 (41 KB)) - 13:35, 28 February 2024
 https://creativecommons.org/licenses/by-sa/4.0CC BY-SA 4.0 Creative Commons Attribution-Share Alike 4.0 truetrue English Real GDP per capita development of Sri Lanka...(850 × 600 (39 KB)) - 17:27, 23 April 2024
 16:11 Khalidshou 900×794× (73386 bytes) {{Information |Description = GDP per capita of china provinces in 2009 |Source = I (~~~) created this work entirely...(900 × 794 (120 KB)) - 07:43, 19 May 2023
 org/licenses/by-sa/4.0CC BY-SA 4.0 Creative Commons Attribution-Share Alike 4.0 truetrue English Historical GDP per capita development in Mozambique...(1,014 × 651 (42 KB)) - 16:38, 13 February 2022
 https://creativecommons.org/licenses/by-sa/4.0CC BY-SA 4.0 Creative Commons Attribution-Share Alike 4.0 truetrue English Historic GDP per capita development of Georgia...(1,009 × 648 (41 KB)) - 16:37, 13 February 2022
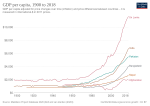 https://creativecommons.org/licenses/by-sa/4.0CC BY-SA 4.0 Creative Commons Attribution-Share Alike 4.0 truetrue English GDP per capita development in South Asia...(850 × 600 (46 KB)) - 16:33, 16 February 2022
 https://creativecommons.org/licenses/by-sa/4.0CC BY-SA 4.0 Creative Commons Attribution-Share Alike 4.0 truetrue English GDP per capita in the Netherlands 1500 to 1815...(1,055 × 659 (56 KB)) - 22:00, 13 February 2022
 org/licenses/by-sa/4.0CC BY-SA 4.0 Creative Commons Attribution-Share Alike 4.0 truetrue English Colombian departments by GDP per capita determination method: SHA-1...(1,020 × 1,814 (176 KB)) - 18:23, 1 April 2024
 org/licenses/by-sa/4.0CC BY-SA 4.0 Creative Commons Attribution-Share Alike 4.0 truetrue English Real GDP per capita development in the Philippines 1965–1986...(850 × 600 (26 KB)) - 17:27, 23 April 2024
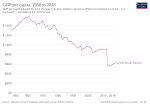 https://creativecommons.org/licenses/by-sa/3.0CC BY-SA 3.0 Creative Commons Attribution-Share Alike 3.0 truetrue English GDP per capita in the Central African Republic...(850 × 600 (31 KB)) - 22:05, 15 February 2022
 https://creativecommons.org/licenses/by-sa/3.0CC BY-SA 3.0 Creative Commons Attribution-Share Alike 3.0 truetrue English GDP per capita development of Central Asia...(1,028 × 648 (64 KB)) - 20:38, 14 February 2022
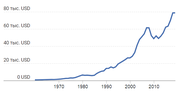 BY-SA 4.0 Creative Commons Attribution-Share Alike 4.0 truetrue English Ireland GDP per capita author name string: Anton n Wikimedia username: Anton n...(663 × 334 (15 KB)) - 00:18, 20 October 2022
 org/licenses/by-sa/4.0CC BY-SA 4.0 Creative Commons Attribution-Share Alike 4.0 truetrue English GDP per capita (2022 US$) determination method: SHA-1...(1,333 × 768 (54 KB)) - 01:30, 17 February 2024
 BY-SA 4.0 Creative Commons Attribution-Share Alike 4.0 truetrue English GDP per capita in each US state author name string: Radom1967 URL: https://commons...(5,175 × 2,872 (1.86 MB)) - 17:51, 16 February 2023
 org/licenses/by-sa/4.0CC BY-SA 4.0 Creative Commons Attribution-Share Alike 4.0 truetrue English Reak GDP per capita development of the Republic of the Congo...(850 × 600 (31 KB)) - 17:27, 23 April 2024
 Real GDP per capita in 2011 US dallars in East Asia(Japan, North Korea, South Korea, Taiwan), 1870-2018 Japanese 日本、北朝鮮、韓国、台湾の一人当たり購買力平価で換算したGDP...(953 × 669 (99 KB)) - 02:16, 22 December 2022
 org/licenses/by-sa/4.0CC BY-SA 4.0 Creative Commons Attribution-Share Alike 4.0 truetrue English GDP per capita development in the Philippines 1965-1986...(1,034 × 653 (41 KB)) - 04:28, 14 February 2022
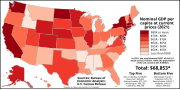 0 Creative Commons Attribution-Share Alike 4.0 truetrue English The GDP per capita of each U.S. state and the District of Columbia in 2021 according to...(1,199 × 593 (71 KB)) - 10:58, 4 June 2022
 Creative Commons Attribution-Share Alike 4.0 truetrue English Real US GDP per capita in thousands of 2012 dollars in 5 epocs Wikimedia username: DavidMCEddy...(504 × 504 (24 KB)) - 10:23, 15 December 2023
 org/licenses/by-sa/3.0CC BY-SA 3.0 Creative Commons Attribution-Share Alike 3.0 truetrue English GDP per capita development of Argentina, Chile and Uruguay...(1,039 × 654 (59 KB)) - 22:34, 14 February 2022
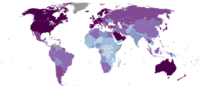 Commons Attribution-Share Alike 4.0 truetrue English Countries by GDP (PPP) per capita (Int$) in 2019 according to the IMF Turkish Uluslararası Para Fonu'na...(5,990 × 2,740 (1.54 MB)) - 05:51, 22 April 2024
 Analysis of top 40 largest national economies (GDP) by plotting GDP per capita vs. 'energy efficiency' (GDP per million Btus consumed); an inverse examination...(998 × 665 (136 KB)) - 18:32, 24 September 2020
 I, the copyright holder of this work, hereby publish it under the following license: English GDP per capita of Thai province...(3,285 × 5,779 (235 KB)) - 13:02, 7 January 2024
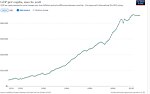 https://creativecommons.org/licenses/by-sa/4.0CC BY-SA 4.0 Creative Commons Attribution-Share Alike 4.0 truetrue English Historical GDP per capita development in Sweden...(1,031 × 648 (41 KB)) - 13:42, 24 April 2024
 org/licenses/by-sa/3.0CC BY-SA 3.0 Creative Commons Attribution-Share Alike 3.0 truetrue English Development of real GDP per capita in Central America...(850 × 600 (73 KB)) - 10:42, 26 May 2022
 org/licenses/by-sa/4.0CC BY-SA 4.0 Creative Commons Attribution-Share Alike 4.0 truetrue English Real GDP per capita development of the Democratic Republic of the Congo...(850 × 600 (31 KB)) - 17:27, 23 April 2024
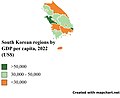 BY-SA 4.0 Creative Commons Attribution-Share Alike 4.0 truetrue English South Korean regions by GDP per capita, 2022 (US$) determination method: SHA-1...(2,899 × 2,361 (354 KB)) - 12:06, 23 December 2023
 org/licenses/by-sa/3.0CC BY-SA 3.0 Creative Commons Attribution-Share Alike 3.0 truetrue English This file shows GDP per capita in relation to E-waste dump sites....(738 × 338 (146 KB)) - 10:36, 12 May 2022
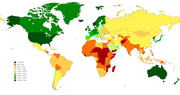 Commons Attribution-Share Alike 4.0 truetrue English World map of nominal GDP per capita in U.S. dollars URL: https://commons.wikimedia.org/wiki/User:Sunrise_Sydney...(6,459 × 3,403 (4.72 MB)) - 21:28, 12 May 2023
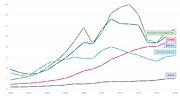 hereby publish it under the following license: English BRICS countries GDP per Capita 2000-2018, current US dollars URL: https://commons.wikimedia.org/wiki/user:Kurgus...(769 × 420 (66 KB)) - 03:27, 11 October 2023
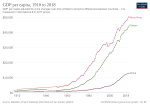 org/licenses/by-sa/4.0CC BY-SA 4.0 Creative Commons Attribution-Share Alike 4.0 truetrue English German GDP per capita in Hong Kong, Taiwan and Mailand China...(850 × 600 (49 KB)) - 13:54, 24 April 2022
 org/licenses/by-sa/4.0CC BY-SA 4.0 Creative Commons Attribution-Share Alike 4.0 truetrue English GDP Per Capita Ethiopia under H.I.M Haile Selassie I 1950-1973...(3,400 × 2,825 (501 KB)) - 04:21, 9 February 2024
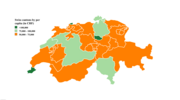 Commons Attribution-Share Alike 4.0 truetrue English Swiss cantons by GDP per capita (in CHF) author name string: Radom1967 Wikimedia username: Radom1967...(3,150 × 1,750 (308 KB)) - 08:22, 12 February 2024
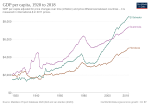 org/licenses/by-sa/4.0CC BY-SA 4.0 Creative Commons Attribution-Share Alike 4.0 truetrue English GDP per capita development in El Salvador, Guatemala and Honduras...(850 × 600 (54 KB)) - 16:33, 16 February 2022
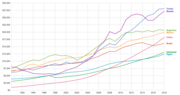 BY-SA 4.0 Creative Commons Attribution-Share Alike 4.0 truetrue English GDP per capita PPP Emerging economies Wikimedia username: Metuboy URL: https://commons...(2,206 × 1,170 (351 KB)) - 04:35, 17 February 2022
 Creative Commons Attribution-Share Alike 4.0 truetrue English Real US GDP per capita 1790-2021 in thousands of 2012 dollars Wikimedia username: DavidMCEddy...(504 × 504 (17 KB)) - 10:23, 15 December 2023
 and residual sum of squares for breakpoint analysis of growth in US GDP per capita author name string: DavidMCEddy URL: https://commons.wikimedia...(504 × 504 (37 KB)) - 10:23, 15 December 2023
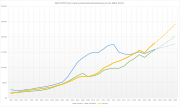 Commons Attribution-Share Alike 4.0 truetrue English Evolution of GDP PPP per capita of Georgia, Armenia & Azerbaijan Wikimedia username: Giorgi Balakhadze...(1,305 × 770 (187 KB)) - 08:02, 28 August 2023
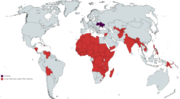 Creative Commons Attribution-Share Alike 4.0 truetrue English Ukraine's GDP per capita compared to the World (2020) author name string: Radom1967 Wikimedia...(6,110 × 3,369 (1.67 MB)) - 18:36, 28 December 2021
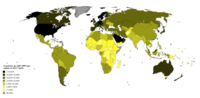 Commons Attribution-Share Alike 4.0 truetrue English Countries by GDP (PPP) per capita in 2017 according to the IMF URL: https://commons.wikimedia...(6,300 × 3,082 (1.93 MB)) - 05:51, 22 April 2024
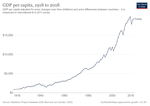 Creative Commons Attribution-Share Alike 4.0 truetrue English Change in per capita GDP of Turkey, 1913–2018. Figures are inflation-adjusted to 2011 International...(3,400 × 2,400 (343 KB)) - 20:53, 9 January 2024
 Creative Commons Attribution-Share Alike 4.0 truetrue English Cuba's GDP per capita (USD), 2010-2020 Armenian Կուբայի ՀՆԱ-ն՝ մեկ շնչին բաժին ընկնող հաշվով...(1,250 × 546 (55 KB)) - 12:16, 27 April 2024
 Attribution-Share Alike 4.0 truetrue English Ceremonial counties in England by GDP per capita US$, 2021 author name string: Radom1967 Wikimedia username: Radom1967...(3,010 × 2,335 (425 KB)) - 02:55, 19 February 2024
 Creative Commons Attribution-Share Alike 4.0 truetrue English Cambridge GDP per capita, 2010-2019 Armenian Քեմբրիջի մեկ շնչի հաշվով ՀՆԱ-ն, 2010-2019 author...(1,207 × 508 (81 KB)) - 07:51, 28 January 2024
 Modified version of Image:Western Europe European nations by growth in GDP per capita in from 1990 to 2002. Numbers from the UNDP[1] Uploaded on 15 October...(341 × 179 (7 KB)) - 19:17, 5 October 2020
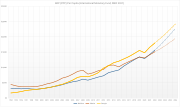 Commons Attribution-Share Alike 4.0 truetrue English Evolution of GDP PPP per capita of Georgia, Moldova & Ukraine Wikimedia username: Giorgi Balakhadze...(1,305 × 770 (185 KB)) - 08:02, 28 August 2023
 Commons Attribution-Share Alike 4.0 truetrue English For this data GDP per capita with purchasing power parity (PPP) is correlated 14 % with the Palma...(1,506 × 850 (82 KB)) - 03:58, 8 October 2020
 truetrue English Optimal breakpoint constant growth model of US real GDP per capita author name string: DavidMCEddy URL: https://commons.wikimedia...(504 × 504 (23 KB)) - 10:23, 15 December 2023
 Attribution-Share Alike 4.0 truetrue English China vs World by Nominal GDP per capita in 2019 author name string: JShark Wikimedia username: JShark URL: https://commons...(6,276 × 3,217 (1.62 MB)) - 22:08, 28 February 2024
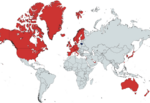 Creative Commons Attribution-Share Alike 4.0 truetrue English Lithuania's GDP per capita compared to rest of the world (2020) author name string: Radom1967 Wikimedia...(2,390 × 1,638 (497 KB)) - 21:30, 15 December 2023
 BY-SA 4.0 Creative Commons Attribution-Share Alike 4.0 truetrue English GDP per capita in Germany (USD), 2011-2021 Armenian Մեկ շնչին բաժին ընկնող ՀՆԱ-ի ցուցանիշները...(1,245 × 535 (59 KB)) - 14:23, 12 January 2024
 Commons Attribution-Share Alike 4.0 truetrue English Evolution of GDP PPP per capita of Georgia compared to other countries URL: https://commons.wikimedia...(1,305 × 770 (210 KB)) - 08:02, 28 August 2023
- whether they correlate with floods coverage. These variables are GDP per capita, GNI per capita, country, continent, date, fatalities, number of English speakers...16 KB (2,004 words) - 05:15, 3 December 2020
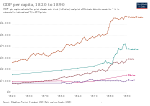 0CC BY-SA 4.0 Creative Commons Attribution-Share Alike 4.0 truetrue English GDP per capita comparision, 1820-1890, Brazil, Chile, Argentina, Mexico, US...(850 × 600 (38 KB)) - 17:27, 23 April 2024
 Commons Attribution-Share Alike 4.0 truetrue English For this data GDP per capita with purchasing power parity (PPP) is correlated 10 % with the ratio...(1,506 × 850 (82 KB)) - 03:58, 8 October 2020
 original. https://creativecommons.org/licenses/by-sa/4.0CC BY-SA 4.0 Creative Commons Attribution-Share Alike 4.0 truetrue English Nominal GDP per capita...(2,192 × 1,135 (2.18 MB)) - 09:29, 18 May 2023
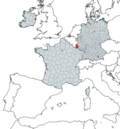 Attribution-Share Alike 4.0 truetrue English NUTS-3 regions in EU with GDP per capita over 100,000 EUR author name string: Radom1967 Wikimedia username: Radom1967...(3,607 × 3,875 (2.27 MB)) - 22:09, 1 April 2024
 Attribution-Share Alike 4.0 truetrue English African countries by GDP (PPP) per capita in 2020 author name string: ព្រះមហាក្សត្ររាជ URL: https://commons...(4,800 × 4,795 (1.05 MB)) - 21:07, 16 December 2023
 BY-SA 4.0 Creative Commons Attribution-Share Alike 4.0 truetrue English GDP per capita (current US$) in countries of the region during the COVID-19 pandemic...(987 × 702 (89 KB)) - 14:23, 12 January 2024
 set pointsize 0.6 set datafile separator "," unset key set ylabel "GDP per capita" plot "pib.csv" using 1:2 linetype rgb "#FF0000" pt 5 1870,931 1890...(512 × 320 (20 KB)) - 22:58, 27 October 2020
 Attribution-Share Alike 4.0 truetrue English India vs World by Nominal GDP per capita in 2020 URL: https://commons.wikimedia.org/wiki/user:Suryakant_Bharti...(6,460 × 3,480 (1.98 MB)) - 08:29, 20 February 2021
 Attribution-Share Alike 4.0 truetrue English China vs World by Nominal GDP per capita in 2020 URL: https://commons.wikimedia.org/wiki/user:Suryakant_Bharti...(6,460 × 3,480 (1.72 MB)) - 22:08, 28 February 2024
- CAGR of 26 percent. Devices and connections per capita, average speeds, and average traffic per capita per month are all expected to rise globally. Mobile...35 KB (3,194 words) - 16:55, 18 February 2024
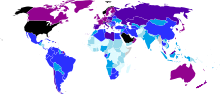 English Spanish (formal address) 一人当たりのGDP世界地図 URL: https://commons.wikimedia.org/wiki/user:Rfassbind Wikimedia username: Rfassbind author name string:...(1,405 × 601 (389 KB)) - 23:13, 4 August 2023
 truetrue English Normal probability plot of annual growth in real US GDP per capita 1790-2021 Wikimedia username: DavidMCEddy URL: https://commons.wikimedia...(504 × 504 (100 KB)) - 10:23, 15 December 2023
 0 truetrue English GDP per capita; adjusted for inflation and expressed in international-$ in 2011 prices. Spanish Renta per cápita mundial en los dos...(1,439 × 868 (30 KB)) - 04:24, 12 January 2024
 Commons Attribution-Share Alike 4.0 truetrue English Countries by GDP (PPP) per capita in 2020 author name string: ព្រះមហាក្សត្ររាជ URL: https://commons...(5,990 × 2,740 (1.25 MB)) - 05:51, 22 April 2024
 shows countries by their GDP (PPP) per capita in 2024 Spanish Esta imagen muestra los países según su PIB (PPA) per cápita en 2024. Hindi यह छवि 2024...(2,192 × 1,135 (1.7 MB)) - 20:56, 6 May 2024
 Attribution-Share Alike 4.0 truetrue English Asian countries with the highest GDP per capita, 2020 Armenian Մեկ շնչի հաշվով ՀՆԱ-ի ամենաբարձր ցուցանիշ ունեցող երկրները...(512 × 288 (77 KB)) - 22:44, 26 September 2023
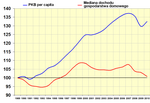 2010-09-16T19:57:07Z Frichmon 911x623 (32140 Bytes) {{Information |Description={{en|1=GDP per capita versus mean household income}} |Source={{own}} |Author=[[User:Frichmon|Frichmon]]...(911 × 623 (19 KB)) - 22:56, 24 September 2020
 Attribution 4.0 truetrue English Argentina. GDP per capita PPP (constant 2011) 1990-2018. WB Spanish Argentina. PIB per cápita PPP (constante 2011) 1990-2018. BM...(799 × 632 (52 KB)) - 07:52, 13 September 2020
 Creative Commons Attribution-Share Alike 4.0 truetrue English Consumption-based CO₂ emissions per capita vs GDP per capita, 2020 determination method: SHA-1...(850 × 696 (87 KB)) - 06:41, 24 April 2024
- Se espera que los dispositivos y conexiones per cápita, la velocidad media y el tráfico medio per cápita por mes aumenten a nivel mundial. Se espera que...33 KB (3,583 words) - 16:55, 18 February 2024
 economic growth is not translating to higher family incomes. U.S. real GDP per household, a measure of average total income per household, has increased...(837 × 436 (41 KB)) - 06:53, 27 February 2023
- financial centre alongside New York City and has the fifth-largest city GDP in the world (and the largest in Europe). It has the most international visitors...79 KB (7,117 words) - 04:44, 24 April 2023
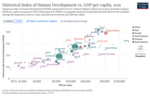 org/licenses/by-sa/4.0CC BY-SA 4.0 Creative Commons Attribution-Share Alike 4.0 truetrue English Historical Index of Human Development vs. GDP per capita, 2015...(1,648 × 1,050 (317 KB)) - 04:29, 30 June 2023
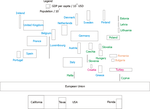 European Union, showing member states and candidates, population and GDP per capita. Added also a comparison with USA. Data based on year 2001. Created...(1,000 × 728 (39 KB)) - 23:24, 30 April 2020
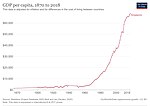 https://creativecommons.org/licenses/by-sa/4.0CC BY-SA 4.0 Creative Commons Attribution-Share Alike 4.0 truetrue English GPD per capita development of Singapore...(3,400 × 2,400 (463 KB)) - 14:42, 17 June 2023
 Real GDP per capita Household net worth Federal budget deficit as % GDP FRED-All Employees Total Non-Farm-Retrieved January 22, 2018 FRED-Real GDP per...(1,408 × 793 (183 KB)) - 06:50, 27 February 2023
- major governance indicator or ranking, below nations with similar per capita GDPs. Support Important aspect of the country, not in any other languages...35 KB (4,259 words) - 19:43, 12 May 2024
 map showing the GDP per capita of the European Union members. http://commons.wikimedia.org/wiki/Image:655px-European_Union_GDP_per_capita.png == Licensing...(1,104 × 920 (66 KB)) - 09:08, 21 October 2020
 Commons Attribution-Share Alike 4.0 truetrue English Countries by GDP (nominal) per capita in 2019 URL: https://commons.wikimedia.org/wiki/user:Asus2004 Wikimedia...(2,911 × 1,297 (2.08 MB)) - 05:51, 22 April 2024
 Creative Commons Attribution-Share Alike 4.0 truetrue English World map for Indicator 8.1.1 in 2015:Annual growth rate of real GDP per employed person...(3,400 × 2,400 (792 KB)) - 17:28, 23 April 2024
 English Vietnamese GDP (danh nghĩa) bình quân đầu người. Sử dụng bản đồ thế giới của Wikipedia và thông tin từ IMF URL: https://commons.wikimedia...(2,250 × 1,117 (170 KB)) - 17:51, 8 December 2021
 real GDP per capita (vertical) vs. scores on standardized tests of student achievement 1960-2000 (horizontal), both adjusted for 1960 GDP per capita Spanish...(630 × 630 (27 KB)) - 12:02, 17 December 2023
 truetrue English Indian states & UTs by NSDP per capita (Nominal). Not to be confused with GDP per capita. NSDP is a bit lower and the data is from 2018-2019...(1,146 × 1,381 (272 KB)) - 22:11, 19 November 2022
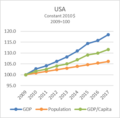 Attribution-Share Alike 4.0 truetrue English USA relative growth of per capita GDP, population, and GDP for the period 2009 - 17 URL: https://commons.wikimedia...(438 × 429 (17 KB)) - 00:38, 30 October 2020
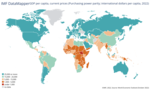 https://creativecommons.org/licenses/by/4.0CC BY 4.0 Creative Commons Attribution 4.0 truetrue English GDP (PPP) per capita by country map, IMF Oct 2022....(2,640 × 1,585 (555 KB)) - 08:02, 28 August 2023
 Attribution-Share Alike 4.0 truetrue English The relative change of per capita GDP, population, and total GDP for Japan for the period 2009-20017 Wikimedia username:...(432 × 430 (14 KB)) - 13:34, 28 February 2024
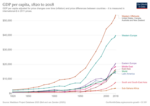 https://creativecommons.org/licenses/by-sa/4.0CC BY-SA 4.0 Creative Commons Attribution-Share Alike 4.0 truetrue English Basque BPG per capita 1820tik 2018ra...(3,400 × 2,400 (572 KB)) - 05:38, 28 April 2021
 real GDP per capita (vertical) vs. scores on standardized tests of student achievement 1960-2000 (horizontal), both adjusted for 1960 GDP per capita Spanish...(960 × 960 (71 KB)) - 12:02, 17 December 2023
 this work, hereby publish it under the following license: English GDP (PPP) per capita map of the Arab League (October 2023 IMF data) instance of: map source...(950 × 550 (169 KB)) - 00:12, 1 February 2024
 DescriptionLibya GDP per capita.png English: GDP (PPP) per capita 1980-2016, IMF World Economic Outlook Database, April 2017 https://www.imf...(744 × 424 (30 KB)) - 06:53, 27 February 2023
- of electricity in 2005 was 191.3 TWh, which corresponds to 1,801 kWh per capita. Electricity demand has grown steadily in the last decade and the Energy...34 KB (3,484 words) - 18:33, 2 December 2007
 2009 1,024×732 (96 KB) Will O'Neil (talk | contribs) (Chart of per-capita real GDP (data from MeasuringWorth.com) with significant events noted. The red...(1,024 × 732 (96 KB)) - 11:27, 29 August 2022
 https://creativecommons.org/licenses/by-sa/4.0CC BY-SA 4.0 Creative Commons Attribution-Share Alike 4.0 truetrue English Real GDP per capita development of Modova...(1,024 × 652 (41 KB)) - 15:03, 16 February 2022
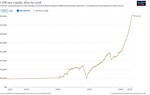 https://creativecommons.org/licenses/by-sa/4.0CC BY-SA 4.0 Creative Commons Attribution-Share Alike 4.0 truetrue English GDP per capita development of the Philippines...(1,025 × 649 (44 KB)) - 16:35, 19 January 2024
 DescriptionAfrica GDP per capita 2009.svg English: Map of Africa indicating Gross Domestic Product per capita 2009. Date 9 July 2009 Source Modified from...(1,000 × 1,000 (203 KB)) - 15:26, 23 July 2023
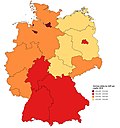 Attribution-Share Alike 4.0 truetrue English German states by nominal GRP per capita in 2018 object has role: photographer author name string: Radom1967 Wikimedia...(4,235 × 4,505 (1.66 MB)) - 12:37, 27 December 2022
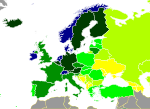 derivative work of the following images: File:Map of countries by GDP (PPP) per capita in 2021.svg licensed with Cc-by-sa-4.0 2021-09-13T01:46:03Z Abraararique...(440 × 319 (671 KB)) - 05:22, 27 January 2022
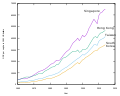 Creative Commons Attribution-Share Alike 4.0 truetrue English Vietnamese GDP bình quân đầu người của Bốn con hổ châu Á (Singapore, Hồng Kông, Đài Loan...(600 × 480 (15 KB)) - 15:25, 26 April 2023
 (UTC) | Usfirstgov | 165199 (bytes) | 781×507 | {{Information |Description = GDP by State in Mexico |Source = I (~~~) created this work entirely by myself...(781 × 507 (161 KB)) - 07:41, 7 October 2020
 truetrue English Countries by GDP (PPP) per capita (Int$) in 2018 according to the IMF Simplified Chinese 2018年世界各国人均GDP(PPP)(数据来自IMF) Persian کشورها بر...(6,300 × 3,190 (1.07 MB)) - 05:51, 22 April 2024
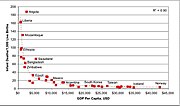 1103×649× (142818 bytes) made by DonaHarr2, 10 April 2005. Adapted from World per capita GDP and infant mortality rankings, CIA Worldfactbook 2006. English...(1,103 × 649 (139 KB)) - 05:50, 2 October 2020
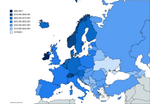 File:MapChart Map (5).png (category GDP per capita)truetrue English Map of sovereign states in Europe by projected 2023 GDP (PPP) per capita based on international dollars author name string: NecromancerOfEnchanting...(4,592 × 3,196 (1.52 MB)) - 08:54, 23 November 2023
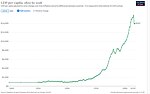 https://creativecommons.org/licenses/by/4.0CC BY 4.0 Creative Commons Attribution 4.0 truetrue English Historical GDP per capita of Brazil determination method: SHA-1...(1,037 × 653 (44 KB)) - 21:52, 4 October 2023
 truetrue English Healthy life expectancy (HALE) at birth (years) vs GDP per capita in different countries author name string: Maayan33 Wikimedia username:...(1,514 × 914 (305 KB)) - 16:21, 6 October 2023
 Creative Commons Attribution-Share Alike 4.0 truetrue English Real GDP per capitas of countries relative to the US' using Maddison Project Database author...(960 × 642 (68 KB)) - 10:23, 15 December 2023
 Source : GDP (per capita) (most recent) by country English Wikimedia username: Urban URL: https://commons.wikimedia.org/wiki/user:Urban author name string:...(480 × 335 (73 KB)) - 06:51, 27 February 2023
 DescriptionGDP per capita PPP 2014-en.svg Français : Carte du monde du produit intérieur brut par habitant à parité de pouvoir d’achat en dollar international...(1,024 × 559 (486 KB)) - 09:26, 8 March 2023
 DescriptionEAEU GDP per capita.svg English: Projected GDP (nominal) per capita in EAEU countries (International Monetary Fund, WEO 2021) Date 13 October...(1,281 × 641 (168 KB)) - 08:02, 28 August 2023
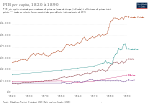 Attribution-Share Alike 4.0 truetrue English Portuguese Comparação do PIB per capita, no período de 1820 a 1890, do Brasil, Chile, Argentina, México e Estados...(850 × 600 (63 KB)) - 17:27, 23 April 2024
 BY-SA 4.0 Creative Commons Attribution-Share Alike 4.0 truetrue English GDP per capita of Vietnam author name string: Tusado Wikimedia username: Tusado URL:...(798 × 713 (52 KB)) - 13:21, 22 January 2023
 fertility rate (2009 est.) [2] archive copy at the Wayback Machine GDP per capita [3] archive copy at the Wayback Machine English author name string:...(900 × 750 (17 KB)) - 07:17, 8 April 2024
 of "WikiGDP per [million] capita" for Asian country WikiProjects. FA 3 GDP points, A 2 points, GA 1 point. Countries shown only if total WikiGDP >= 5 points...(911 × 623 (19 KB)) - 13:21, 9 October 2020
 0CC BY-SA 3.0 Creative Commons Attribution-Share Alike 3.0 truetrue English GDP per capita in Argentina from 1998 to 2005 determination method: SHA-1...(850 × 600 (25 KB)) - 09:08, 13 September 2023
 Attribution-Share Alike 4.0 truetrue English Map of countries by GDP (PPP) per capita in 2022 by IMF URL: https://commons.wikimedia.org/wiki/User:NeonFor...(2,192 × 1,135 (509 KB)) - 14:22, 31 October 2022
 Attribution-Share Alike 4.0 truetrue English European countries as US states by GDP PPP per capita, 2018 object has role: photographer author name string: Radom1967...(3,683 × 2,850 (1.46 MB)) - 21:23, 5 February 2024
 https://creativecommons.org/licenses/by-sa/4.0CC BY-SA 4.0 Creative Commons Attribution-Share Alike 4.0 truetrue English GDP per capita development of Uruguay...(1,019 × 649 (42 KB)) - 05:12, 30 November 2023
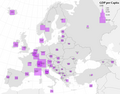 Creative Commons Attribution-Share Alike 4.0 truetrue English Map of GDP per capita in Europe, 2018 URL: https://commons.wikimedia.org/wiki/user:Bplewe...(3,122 × 2,451 (806 KB)) - 17:01, 2 January 2023
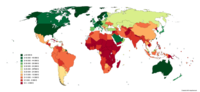 Attribution-Share Alike 4.0 truetrue English Map of countries by GDP (PPP) per capita in 2020 (new) Russian Карта стран по ВВП (ППС) на душу населения...(7,192 × 3,318 (2.13 MB)) - 05:51, 22 April 2024
 Creative Commons Attribution-Share Alike 4.0 truetrue English GDP Indicators per capita of italy Armenian Մեկ շնչին ընկնող ՀՆԱ-ի ցուցանիշներն Իտալիայում...(2,064 × 1,322 (187 KB)) - 14:23, 12 January 2024
 https://creativecommons.org/licenses/by-sa/4.0CC BY-SA 4.0 Creative Commons Attribution-Share Alike 4.0 truetrue English GDP per capita development of Ethiopia...(1,018 × 648 (45 KB)) - 16:37, 13 February 2022
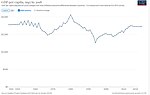 https://creativecommons.org/licenses/by-sa/4.0CC BY-SA 4.0 Creative Commons Attribution-Share Alike 4.0 truetrue English Historic GDP per capita development of Haiti...(1,029 × 649 (41 KB)) - 16:30, 13 February 2022
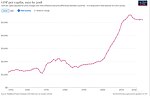 https://creativecommons.org/licenses/by-sa/4.0CC BY-SA 4.0 Creative Commons Attribution-Share Alike 4.0 truetrue English GDP per capita development of Nigeria...(1,019 × 651 (43 KB)) - 23:33, 12 February 2022
 https://creativecommons.org/licenses/by/4.0CC BY 4.0 Creative Commons Attribution 4.0 truetrue English Change in per Capita CO2 emissions and GDP, Switzerland...(850 × 600 (17 KB)) - 20:48, 9 January 2024
 https://creativecommons.org/licenses/by-sa/4.0CC BY-SA 4.0 Creative Commons Attribution-Share Alike 4.0 truetrue English GDP per capita development of Ghana...(1,022 × 650 (42 KB)) - 23:12, 12 February 2022
 https://creativecommons.org/licenses/by-sa/4.0CC BY-SA 4.0 Creative Commons Attribution-Share Alike 4.0 truetrue English GDP per capita development of Bangladesh...(1,015 × 651 (45 KB)) - 16:37, 13 February 2022
 Attribution-Share Alike 4.0 truetrue English Map of countries by GDP (PPP) per capita in 2022 by IMF author name string: Skyscraper cities Wikimedia username:...(2,192 × 1,135 (519 KB)) - 18:11, 17 March 2024
 https://creativecommons.org/licenses/by-sa/4.0CC BY-SA 4.0 Creative Commons Attribution-Share Alike 4.0 truetrue English GDP per capita development of South Africa...(1,028 × 650 (46 KB)) - 23:33, 12 February 2022
 https://creativecommons.org/licenses/by-sa/4.0CC BY-SA 4.0 Creative Commons Attribution-Share Alike 4.0 truetrue English Historic GDP per capita development of Iraq...(1,027 × 655 (45 KB)) - 16:37, 13 February 2022
 original. https://creativecommons.org/licenses/by-sa/4.0CC BY-SA 4.0 Creative Commons Attribution-Share Alike 4.0 truetrue English GDP per Capita of Congo DR...(1,010 × 619 (37 KB)) - 14:13, 19 February 2023
 https://creativecommons.org/licenses/by-sa/4.0CC BY-SA 4.0 Creative Commons Attribution-Share Alike 4.0 truetrue English Historical development of GDP per capita of Cuba...(1,022 × 650 (47 KB)) - 16:37, 13 February 2022
 https://creativecommons.org/licenses/by/4.0CC BY 4.0 Creative Commons Attribution 4.0 truetrue English Change in per Capita CO2 emissions and GDP, Germany...(850 × 600 (17 KB)) - 20:48, 9 January 2024
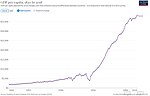 https://creativecommons.org/licenses/by-sa/4.0CC BY-SA 4.0 Creative Commons Attribution-Share Alike 4.0 truetrue English GDP per capita development in France...(1,013 × 650 (44 KB)) - 22:22, 12 February 2022
 https://creativecommons.org/licenses/by-sa/4.0CC BY-SA 4.0 Creative Commons Attribution-Share Alike 4.0 truetrue English GDP per capita development of Burundi...(1,023 × 643 (42 KB)) - 16:37, 13 February 2022
 https://creativecommons.org/licenses/by-sa/4.0CC BY-SA 4.0 Creative Commons Attribution-Share Alike 4.0 truetrue English GDP per capita development of Argentina...(1,030 × 651 (41 KB)) - 16:30, 13 February 2022
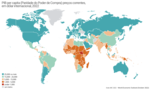 countries by GDP (PPP) per capita, 2022 (in US dollars) from the International Monetary Fund. Portuguese Mapa de países por PIB (PPP) per capita (em dólares...(2,840 × 1,705 (768 KB)) - 14:56, 6 March 2024
 https://creativecommons.org/licenses/by-sa/4.0CC BY-SA 4.0 Creative Commons Attribution-Share Alike 4.0 truetrue English German GDP per Capita of Angola...(1,017 × 648 (41 KB)) - 23:46, 12 February 2022
 https://creativecommons.org/licenses/by-sa/4.0CC BY-SA 4.0 Creative Commons Attribution-Share Alike 4.0 truetrue English GDP per capita development of Greece...(1,012 × 650 (44 KB)) - 16:37, 13 February 2022
 https://creativecommons.org/licenses/by-sa/4.0CC BY-SA 4.0 Creative Commons Attribution-Share Alike 4.0 truetrue English Historic GDP per capita development of Yemen...(1,013 × 648 (41 KB)) - 16:38, 13 February 2022
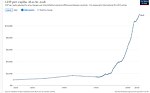 BY-SA 4.0 Creative Commons Attribution-Share Alike 4.0 truetrue English GDP per capita development of Egypt 1820-2018 German Wirtschaftsleistung pro Kopf in...(1,036 × 643 (38 KB)) - 22:22, 12 February 2022
 https://creativecommons.org/licenses/by-sa/4.0CC BY-SA 4.0 Creative Commons Attribution-Share Alike 4.0 truetrue English GDP per capita development of Bulgaria...(1,023 × 653 (48 KB)) - 16:37, 13 February 2022
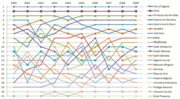 DescriptionCroatia counties GDP per capita rank 2000 2009.png English: Croatian counties' GDP per capita ranking 2000-2009 Date 8 June 2012 Source Own...(844 × 462 (49 KB)) - 10:02, 25 April 2024
 Commons Attribution-Share Alike 4.0 truetrue English IMF data over GDP per capita from 2023 in 2023 US dollar author name string: Peevon Wikimedia username:...(2,640 × 1,585 (503 KB)) - 22:55, 8 April 2024
 original. https://creativecommons.org/licenses/by-sa/4.0CC BY-SA 4.0 Creative Commons Attribution-Share Alike 4.0 truetrue English GDP per capita of Belarus...(1,032 × 651 (46 KB)) - 22:23, 12 February 2022
 https://creativecommons.org/licenses/by-sa/4.0CC BY-SA 4.0 Creative Commons Attribution-Share Alike 4.0 truetrue English GDP per capita development of Uganda...(1,042 × 647 (39 KB)) - 23:31, 12 February 2022
 https://creativecommons.org/licenses/by-sa/4.0CC BY-SA 4.0 Creative Commons Attribution-Share Alike 4.0 truetrue English Historical GDP per capita of Germany...(1,043 × 655 (39 KB)) - 04:13, 13 February 2022
 https://creativecommons.org/licenses/by-sa/4.0CC BY-SA 4.0 Creative Commons Attribution-Share Alike 4.0 truetrue English GDP per capita development of North Korea...(1,027 × 649 (42 KB)) - 23:33, 12 February 2022
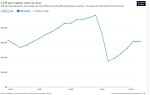 https://creativecommons.org/licenses/by-sa/4.0CC BY-SA 4.0 Creative Commons Attribution-Share Alike 4.0 truetrue English GDP per capita development of Nazi Germany...(1,036 × 653 (40 KB)) - 16:30, 13 February 2022
 Created by SimonP based on Image:Europe-GDP-PPP-per-capita-map.png English...(428 × 395 (84 KB)) - 20:19, 4 January 2023
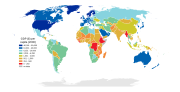 DescriptionGDP per capita-worldmap-2006.svg Gross Domestic Product per capita in 2006, world map (English, svg-version). Using the IMF-data at w:List of...(940 × 477 (2.27 MB)) - 04:00, 23 October 2021
 Creative Commons Attribution-Share Alike 4.0 truetrue English Development GDP per capita of China Persian سرانه تولید ناخالص داخلی چین از ۱۰۰۰ تا ۲۰۱۸ میلادی...(1,016 × 649 (42 KB)) - 09:41, 23 April 2023
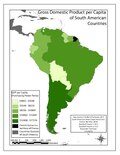 DescriptionGDP DONEpdftry.pdf English: GDP per Capita of South American Countries Date 7 November 2012, 14:28:21 Source Own work Author Fleshma1...(1,275 × 1,650 (511 KB)) - 07:45, 7 October 2020
- per cent of gross domestic product (GDP) growth in Sub-Saharan Africa. A 1 per cent increase in agricultural GDP reduces poverty by more than 1 per cent...31 KB (3,771 words) - 00:00, 13 January 2023
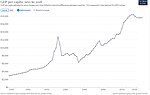 https://creativecommons.org/licenses/by-sa/4.0CC BY-SA 4.0 Creative Commons Attribution-Share Alike 4.0 truetrue English GDP per capita development in Gabon...(1,016 × 643 (45 KB)) - 21:20, 18 February 2022
 All following user names refer to en.wikipedia. 2007-06-04 14:09 Emmanuelm 673×535×8 (112987 bytes) Fertility Rate vs GDP per capita, 2004 English...(673 × 535 (110 KB)) - 13:49, 26 April 2022
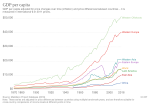 DescriptionGDP per capita, OWID.svg English: :GDP per capita GDP per capita adjusted for price changes over time (inflation) and price differences between...(850 × 600 (13 KB)) - 17:28, 23 April 2024
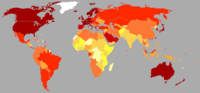 DescriptionGDP per capita (nominal) 2014.png English: GDP per capita 2014 over $129,696 $64,848–129,696 $32,424–64,848 $16,212–32,424 $8,106–16...(1,350 × 625 (38 KB)) - 07:37, 7 October 2020
 DescriptionGDP per capita -2006-blank.svg Nominal per capita GDP Date 16 February 2008 Source self-made based on existing German map by Bamse Author Laurens...(940 × 477 (2.26 MB)) - 14:42, 13 June 2021
 DescriptionBarbados GDP per capita.svg English: This chart graphs the GDP per capita of Barbados between 1960 to 2002 in constant year 2000 US$. Source:...(968 × 630 (43 KB)) - 10:00, 30 October 2023
 DescriptionAfrica GDP per capita 2008.png English: Map of African countries by nominal GDP per capita in 2008 according to IMF Date 16 March 2012 Source...(360 × 360 (17 KB)) - 02:04, 30 December 2023
 DescriptionGdp per capita 1965.png English: Different GDP per capita levels Data based on a west german schoolbook:Harms Geschichts Atlas (1971) ISBN:...(1,280 × 597 (196 KB)) - 15:00, 16 March 2024
 DescriptionGdp per capita ppp world map 2005.PNG English: GDP per capita, purchasing power parity. Polski: PKB per capita (w dolarach amerykańskich): ...(1,357 × 714 (50 KB)) - 01:22, 7 November 2021
 org/licenses/by-sa/4.0CC BY-SA 4.0 Creative Commons Attribution-Share Alike 4.0 truetrue English Traditional Chinese 2021年中國各省人均gdp determination method: SHA-1...(990 × 1,246 (334 KB)) - 01:29, 13 May 2023
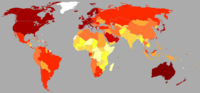 DescriptionGDP per capita (nominal) 2011.png English: Based on IMF data. Previous versions of this image reside in a different account of mine (sadib_en)...(1,350 × 625 (38 KB)) - 07:37, 7 October 2020
 DescriptionGDP per capita PPP vs taxes 2016.svg English: General government revenue from taxes in % of GDP. Social contributions are included. For this...(1,513 × 850 (72 KB)) - 02:39, 23 September 2020
 DescriptionWorld GDP per capita 1500 to 2003.svg English: World average GDP per capita 1500 to 2003. Data extracted from Angus Maddison's "World Population, GDP and...(1,600 × 1,200 (3 KB)) - 02:32, 4 October 2023
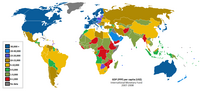 DescriptionGDP PPP per capita IMF.png World map of countries by GDP (PPP) per capita from IMF statistics - 2007 estimates Date 12/03/2008 Source Own work...(1,410 × 640 (40 KB)) - 19:43, 8 October 2020
 DescriptionWorld GDP per capita 1500 to 2003.png English: World average GDP per capita 1500 to 2003. Data extracted from Angus Maddison's "World Population, GDP and...(1,600 × 1,200 (83 KB)) - 10:49, 31 December 2021
 DescriptionCuba GDP per Capita.png English: Cuban GDP per Capita in US$ (1945-2010). Deutsch: Historische Entwicklung des BIP pro Kopf in Kuba (1945-2010)...(5,301 × 3,530 (447 KB)) - 13:13, 27 April 2024
 DescriptionGDP per capita PPP vs excises 2016.svg English: General government revenue, in % of GDP, from excises. For this data, the variance of GDP per capita with...(1,513 × 850 (70 KB)) - 03:58, 8 October 2020
 DescriptionGDP per capita PPP vs direct taxes 2016.svg English: General government revenue, in % of GDP, from direct taxes. For this data, the variance of GDP per...(1,513 × 850 (66 KB)) - 03:58, 8 October 2020
 BY-SA 4.0 Creative Commons Attribution-Share Alike 4.0 truetrue English GDP per capita in Basque Country German Pro-Kopf-BIP in Baskenland Wikimedia username:...(861 × 537 (7 KB)) - 11:23, 17 December 2023
 DescriptionGDP per capita.png English: Estimates of Per Capita GDP in US Dollars 2007. Date 22 February 2009 Source Data obtained from the UN Statistics...(1,800 × 820 (145 KB)) - 10:53, 12 September 2020
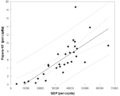 DescriptionPapers per capita - GDP per capita.png English: Number of Papers per capita vs. GDP per capia Sources: Number of papers: Larivière et al. "Bibliometrics:...(741 × 593 (15 KB)) - 12:57, 11 September 2020
 DescriptionGDP per capita PPP 2014-fr.svg Français : Carte du monde du produit intérieur brut par habitant à parité de pouvoir d’achat en dollar international...(1,024 × 559 (486 KB)) - 05:04, 21 September 2023
 DescriptionGDP per capita PPP vs VAT 2016.svg English: General government revenue, in % of GDP, from VAT. For this data, the variance of GDP per capita with...(1,513 × 850 (65 KB)) - 12:06, 30 September 2020
 DescriptionGDP per capita PPP vs CIT 2016.svg English: General government revenue, in % of GDP, from Corporate Income Taxes. For this data, the variance of GDP per...(1,513 × 850 (66 KB)) - 03:58, 8 October 2020
 DescriptionChilean Regions by GDP per capita 2014.png English: Chilean regions by their 2014 regional gross domestic product per capita at purchasing power parity...(940 × 1,509 (268 KB)) - 07:46, 27 February 2024
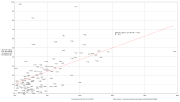 DescriptionGDP per capita PPP vs PIT 2016.svg English: General government revenue, in % of GDP, from personal income taxes. For this data, the variance of GDP per...(1,513 × 850 (62 KB)) - 17:45, 3 April 2024
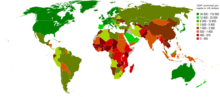 DescriptionGDP (nominal) per capita map.png a map of the world showing GDP (nominal) per capita for each country. Date 03/01/2008 Source self-made using...(940 × 415 (135 KB)) - 03:51, 14 October 2020
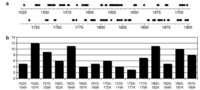 DescriptionGDP Per Capita.png English: GDP Per Capita Date 14 May 2019 Source Own work Author Mengmengyang...(613 × 277 (82 KB)) - 07:43, 7 October 2020
 DescriptionGDP per capita PPP vs social contributions 2016.svg English: General government revenue, in % of GDP, from social contributions. For this data...(1,513 × 850 (68 KB)) - 03:58, 8 October 2020
 DescriptionGDP per capita PPP vs import taxes 2016.svg English: General government revenue, in % of GDP, from import taxes. For this data, the variance of GDP per...(1,513 × 850 (65 KB)) - 03:58, 8 October 2020
 DescriptionGeorgian regions by GDP per capita in 2022 (GEL).png English: Georgian regions by GDP per capita in 2022 (GEL). ქართული: საქართველოს რეგიონები...(1,200 × 722 (64 KB)) - 03:42, 9 April 2024
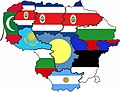 DescriptionNominal GDP per capita in Lithuanian regions as compared with the nominal GDP per capita of sovereign nations.jpg English: Nominal GDP per capita in Lithuanian...(2,122 × 1,619 (658 KB)) - 19:01, 21 January 2023
 DescriptionMap of Africa by 2017 nominal GDP per capita (USD).png English: This Is Updated Map Of Africa by 2017 nominal GDP Per Capita (USD) Date 21 September 2018...(4,800 × 4,795 (884 KB)) - 14:15, 8 September 2022
 DescriptionGDP per capita PPP vs indirect taxes 2016.svg English: General government revenue, in % of GDP, from indirect taxes - includes taxes on goods...(1,513 × 850 (68 KB)) - 03:58, 8 October 2020
 DescriptionGDP per capita PPP vs property taxes 2016.svg English: General government revenue, in % of GDP, from property taxes. For this data, the variance...(1,513 × 850 (63 KB)) - 03:58, 8 October 2020
 DescriptionGDP per capita of Chinese provinces.PNG 中国省份人均GDP分布 Chinese province-level divisions by GDP per capita Date 18 June 2009 Source 自制 Author cncs...(901 × 1,090 (35 KB)) - 01:29, 22 February 2022
 DescriptionGDP per capita - United States, China.svg English: GDP per capita - United States, China (1960-2019) Date 29 March 2021 Source Own work based...(495 × 360 (6 KB)) - 08:02, 28 August 2023
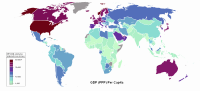 DescriptionGDP PPP Per Capita IMF 2008.svg English: World map showing countries by nominal GDP per capita in 2008, IMF estimates as of April 2009. Sbw01f's...(1,800 × 820 (1.03 MB)) - 14:49, 17 January 2024
 DescriptionWorld GDP per capita 20th century.GIF Real world GDP per capita 1900–2006 in dollars. Interpolated from data for 1900, 1913, 1940 and annual...(337 × 276 (2 KB)) - 08:02, 28 August 2023
 DescriptionIndian states by GDP per capita.png English: Indian_states_by_GDP_per_capita Legend Red - < ₹ 60,000 Orrange - ₹60,000 to ₹80,000 Yellow -...(1,486 × 1,734 (265 KB)) - 16:33, 28 July 2023
 DescriptionChile GDP per capita (PPP).svg English: Gross domestic product per capita in constant PPP prices, 1950-2008. Chile in blue, Latin America average...(766 × 473 (23 KB)) - 07:19, 27 February 2024
 DescriptionGDP per capita LA-Chile.png English: Gross domestic product per capita at constant PPP prices, 1950-2008. Latin America (minus Cuba) in orange...(1,508 × 919 (75 KB)) - 06:53, 27 February 2023
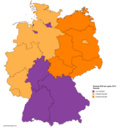 DescriptionNominal GDP per capita, 2015 Eurostat.png English: Nominal GDP per capita, 2015 Eurostat Date 21 August 2017 Source Own work Author No Longer...(4,235 × 4,505 (1.08 MB)) - 06:13, 18 January 2023
 DescriptionGDP (PPP) per capita, 2012 IMF.jpg English: GDP (PPP) per capita data for 2012; released by IMF in April 2013 NOTE: CIA data is used for countries...(3,600 × 1,640 (534 KB)) - 09:21, 27 December 2023
 DescriptionGDP-and-GDP-per-capita-in-England-since-1270.png English: The Malthusian Economy: GDP, GDP per capita, and the size of the population in England...(3,000 × 2,100 (385 KB)) - 17:28, 23 April 2024
 DescriptionGDP per capita URSS.png English: GDP per capita of USSR Español: PIB per capita de la URSS Date 21 August 2017 Source Own work Author Midofe1996...(1,241 × 721 (62 KB)) - 08:08, 1 December 2023
 DescriptionGDP per capita USSR.png Español: PIB per capita de la URSS en comparación con países similares English: GDP per capita of the USSR compared...(1,089 × 656 (75 KB)) - 08:08, 1 December 2023
 DescriptionDiabetes prevalence vs GDP per capita, OWID.svg English: :Diabetes prevalence vs GDP per capita Diabetes prevalence, measured as the percentage...(850 × 600 (43 KB)) - 19:51, 7 May 2024
 DescriptionEuropean-Union-GDP-per-capita-map.png English: Map of GDP per capita (PPP) of EU member states. Based on their GDP per capita PPP when EU avg.100%...(538 × 422 (11 KB)) - 07:21, 14 September 2020
 DescriptionGDP Per Capita Projection.svg English: This chart depicts the projected GDP per capita growth within a Honduran ZEDE up to the year 2050. Date...(512 × 330 (95 KB)) - 09:18, 27 September 2020
 DescriptionMexico GDP per capita 2007.svg A thematic map showing the GDP per capita (nominal, 2007) of the Mexican States. Data is from http://en.wikipedia...(1,000 × 680 (126 KB)) - 17:19, 21 July 2023
 DescriptionMexico GDP per capita 2012.png English: GDP Per Capita of Mexican States in USD, 2012 Date 2 April 2015 Source Own work Author Cig344...(800 × 544 (79 KB)) - 16:45, 8 April 2023
 received per capita vs. GDP per capita, OWID.svg English: :Aid received per capita vs. GDP per capita Total aid received directly per capita versus gross...(850 × 600 (27 KB)) - 10:46, 25 July 2023
 DescriptionMaddison GDP per capita 1500-1950.svg English: Gross domestic product (at purchasing power parity) per capita between 1500 and 1950 in 1990...(512 × 384 (19 KB)) - 06:53, 27 February 2023
 DescriptionProcurement expenditure (% GDP) vs GDP per capita, OWID.svg English: :Procurement expenditure (% GDP) vs GDP per capita The vertical axis shows general...(850 × 600 (14 KB)) - 04:35, 4 November 2022
 DescriptionGreek Macedonia GDP per capita.svg English: GDP per capita (PPP) of the Greek region of Macedonia and its subdivisions in 2008. Date 28 February...(3,258 × 2,519 (427 KB)) - 11:06, 4 June 2022
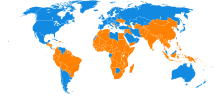 DescriptionAverage GDP PPP per capita new.svg English: Updated World map showing countries below and above the world average GDP PPP (per capita). Date May 2008...(940 × 415 (1.59 MB)) - 05:43, 6 October 2023
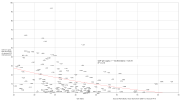 DescriptionGDP per capita PPP vs Gini index 2016.svg English: For this data, variance of GDP per capita with purchasing power parity (PPP) is explained...(1,506 × 850 (557 KB)) - 03:58, 8 October 2020
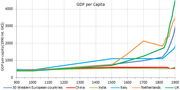 DescriptionGDP per capita 900-1900.png English: GDP per capita 900-1900 in 1990 int$ Date 6 August 2014, 02:16:01 Source Own work Author BoH...(560 × 280 (20 KB)) - 07:37, 7 October 2020
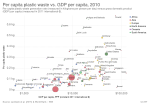 DescriptionPer capita plastic waste vs. GDP per capita, OWID.svg English: :Per capita plastic waste vs. GDP per capita Per capita plastic waste generation...(850 × 600 (30 KB)) - 04:31, 8 November 2023
 DescriptionRegional GDP per capita.png English: Regional GDP per capita Date 12 June 2017 Source Own work Author Eimukas22...(1,600 × 741 (137 KB)) - 13:14, 18 July 2023
 DescriptionGDP per Capita.svg English: GDP per Capita of South American Countries Date 6 November 2012, 16:15:40 Source Own work Author Fleshma1...(612 × 792 (2.67 MB)) - 22:47, 5 October 2020
 DescriptionRomania - Nominal GDP per Capita by County.png English: ROMANIA - GDP PPS per Capita in Euros by County Română: ROMÂNIA - PIB la paritate pe...(1,777 × 1,269 (422 KB)) - 23:05, 27 October 2020
 DescriptionPer capita milk supply vs. GDP per capita, OWID.svg English: :Per capita milk supply vs. GDP per capita Average per capita milk supply, measured...(850 × 600 (32 KB)) - 15:34, 18 March 2022
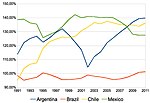 America GDP per capita 1991-2011.jpg English: GDP PPP per capita of Argentina, Brazil, Chile and Mexico (source), as a percentage of the average GDP PPP per...(1,128 × 776 (133 KB)) - 22:23, 15 September 2020
 DescriptionGDP per Capita in Brazil.png Português: Mapa da renda per capita no Brasil por Unidade da Federação. Date 12 March 2013, 04:06:36 Source Own...(1,000 × 881 (105 KB)) - 01:53, 28 January 2022
 DescriptionZim GDP per capita 1980-2010.svg English: This graph illustrates the GDP per capita in constant year 2000 US dollars from 1980 to 2010. The...(600 × 423 (105 KB)) - 06:53, 27 February 2023
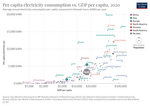 Per capita electricity consumption vs gdp per capita Title Per capita electricity consumption vs gdp per capita Description Per capita electricity consumption...(850 × 600 (98 KB)) - 13:03, 11 August 2023
 DescriptionGDP per capita DONE test.svg English: South American GDP per Capita Date 6 November 2012, 16:47:39 Source Own work Author Fleshma1...(612 × 792 (2.14 MB)) - 07:37, 7 October 2020
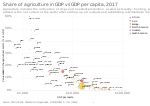 DescriptionShare of agriculture in GDP vs GDP per capita, OWID.svg English: :Share of agriculture in GDP vs GDP per capita Agriculture includes the cultivation...(850 × 600 (42 KB)) - 09:09, 25 May 2023
 DescriptionNominal GDP per capita, 2015 Eurostat France.png English: Nominal GDP per capita, 2015 Eurostat Date 21 August 2017 Source Own work Author No...(4,465 × 3,450 (683 KB)) - 17:42, 30 October 2022
 DescriptionEuropean Union GDP per capita.png English: A map showing the GDP per capita of the European Union members in 2005 Date 11 June 2008 Source IMF...(655 × 600 (141 KB)) - 11:31, 19 September 2022
 DescriptionUS GDP per capita change.PNG English: Change in US GDP per capita Source Own work Author Frichmon...(900 × 613 (26 KB)) - 17:02, 1 October 2020
 DescriptionGDP per capita development in Taiwan.svg English: GDP per capita development in Taiwan Date 16 February 2022 Source https://ourworldindata...(850 × 600 (35 KB)) - 22:56, 18 February 2022
 DescriptionCereal yield vs. GDP per capita, OWID.svg English: :Cereal yield vs. GDP per capita Average cereal yield, measured in kilograms per hectare...(850 × 600 (41 KB)) - 16:58, 23 April 2024
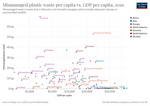 Per capita mismanaged plastic waste vs gdp per capita Title Per capita mismanaged plastic waste vs gdp per capita Description Mismanaged plastic waste...(850 × 600 (92 KB)) - 10:28, 8 October 2023
 File:Muh.png (category GDP maps of the world)Commons Attribution-Share Alike 3.0 truetrue en:List_of_countries_by_GDP_(nominal)_per_capita Gross domestic product English author name string: Leonardojr26...(1,350 × 625 (35 KB)) - 00:50, 26 December 2021
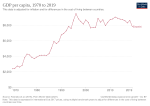 DescriptionEswatini GDP per capita chart.svg Chart showing GDP per capita of Eswatini, 1970 to 2019. This data is adjusted for inflation and for differences...(850 × 600 (29 KB)) - 12:36, 16 October 2023
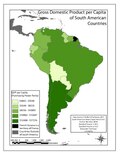 DescriptionGDP DONE.pdf English: Gross Domestic Product per Capita of South American Countries Date 7 November 2012, 14:59:47 Source Own work Author Fleshma1...(1,275 × 1,650 (511 KB)) - 13:15, 11 November 2022
 DescriptionShare of industry in GDP vs GDP per capita, OWID.svg English: :Share of industry in GDP vs GDP per capita The share of the industrial sector...(850 × 600 (56 KB)) - 03:46, 4 November 2022
 DescriptionPer capita sugar food supply vs GDP per capita, OWID.svg English: :Per capita sugar food supply vs GDP per capita Per capita sugar food supply...(850 × 600 (33 KB)) - 05:48, 4 November 2022
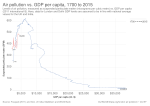 DescriptionAir pollution vs. GDP per capita, OWID.svg English: :Air pollution vs. GDP per capita Levels of air pollution, measured as suspended particulate...(850 × 600 (11 KB)) - 17:14, 23 April 2024
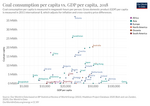 Coal vs gdp per capita Title Coal vs gdp per capita Description Coal consumption per capita vs. GDP per capita, 2018. Coal consumption per capita is measured...(850 × 600 (91 KB)) - 09:08, 8 May 2024
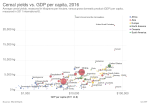 DescriptionCereal yields vs. GDP per capita, OWID.svg English: :Cereal yields vs. GDP per capita Average cereal yields, measured in kilograms per hectare...(850 × 600 (40 KB)) - 16:58, 23 April 2024
 DescriptionGDP per Capita of Germany and Korea.svg English: GDP per capita of Germany and Korea in constant 1990 dollars, from 1950 to 2010 (2008 for...(800 × 600 (13 KB)) - 06:53, 27 February 2023
 DescriptionGdp per capita of Chinese administrative divisions.png English: No data for Sansha city and Chinese Southsea Islands Date 1 October 2022 Source...(2,922 × 2,404 (1.04 MB)) - 10:26, 9 November 2023
 Indicator 12.2.2 in 2017. The map shows domestic material consumption, domestic material consumption per capita, and domestic material consumption per GDP...(3,400 × 2,400 (730 KB)) - 16:30, 19 June 2022
 DescriptionGDP PPP per capita 2007 IMF.png World map showing 2007 estimates about GDP (PPP) per capita (international dollars) Date 2 December 2008 Source...(1,500 × 630 (49 KB)) - 06:17, 31 August 2020
 DescriptionGDP PPP Per Capita IMF 2008.png GDP (PPP) Per Capita based on 2008 [IMF estimates http://www.imf.org/] Date 26 June 2009 Source Own work Author...(1,800 × 820 (186 KB)) - 07:31, 13 September 2020
 Per capita plastic waste vs gdp per capita Title Per capita plastic waste vs gdp per capita Description Per capita plastic waste vs. GDP per capita, 2010...(850 × 600 (104 KB)) - 20:12, 14 July 2023
 DescriptionGDP per capita 2100 - negligible senescence.png English: GDP per capita 2100 - negligible senescence. Two scenario's are considered with a...(1,053 × 622 (54 KB)) - 06:50, 8 April 2024
 DescriptionChile GDP per capita PPP Pinochet.png English: Chile GDP per capita in constant USD, PPP adjusted, 1950-2008 Pinochet period highlighted. Date...(4,000 × 2,464 (118 KB)) - 07:19, 27 February 2024
 emissions per capita vs GDP per capita, OWID.svg English: :CO₂ emissions per capita vs GDP per capita Carbon dioxide (CO₂) emissions per capita are measured...(850 × 600 (31 KB)) - 17:18, 23 April 2024
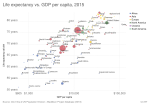 DescriptionLife expectancy vs. GDP per capita, OWID.svg English: Life expectancy vs. GDP per capita Date 2020 (chart creation) Source https://ourworldindata...(850 × 600 (33 KB)) - 17:33, 23 April 2024
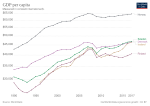 DescriptionGDP per capita of the Nordic countries in USD, 1990 to 2017.svg English: GDP per capita of the Nordic countries in USD from 1990 to 2017. Figures...(850 × 600 (34 KB)) - 17:28, 23 April 2024
 DescriptionGdp per capita of the administrative division in China.png English: Gdp per capita of the administrative division in China Date 2 October 2022...(2,922 × 2,404 (1.14 MB)) - 10:26, 9 November 2023
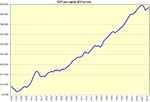 DescriptionUS GDP per capita.PNG English: Historical GDP per capita for the United States Source Own work Author Frichmon...(900 × 613 (27 KB)) - 12:20, 18 October 2020
 DescriptionEstrie GDP per capita.png English: A comparison of GDP per capita between Estrie and the province of Quebec between 2002 and 2011, taken from...(545 × 355 (12 KB)) - 09:26, 24 October 2020
 DescriptionGrowth GDP per capita East Germany.png English: Growth GDP per capita East Germany, Economic Growth of East Germany, GDR economy, GDP growth Date...(770 × 432 (15 KB)) - 01:57, 3 November 2020
 DescriptionDaily protein supply per capita vs. GDP per capita, OWID.svg English: :Daily protein supply per capita vs. GDP per capita Daily protein supply, measured...(850 × 600 (185 KB)) - 17:21, 26 April 2024
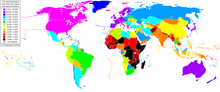 DescriptionGDP PPP per capita 2007 CIA.png World map showing 2007 -or earlier- estimates about GDP (PPP) per capita (international dollars) Date 2 December...(1,500 × 630 (69 KB)) - 06:17, 31 August 2020
 DescriptionShare of agriculture in GDP vs GDP per capita, 1, OWID.svg English: :Share of agriculture in GDP vs GDP per capita The vertical axis shows historical...(850 × 600 (68 KB)) - 09:09, 25 May 2023
 DescriptionNominal GDP per capita of Croatia.png English: Nominal GDP per capita of Croatia, at current prices. Date 6 April 2015 Source Own work Author...(979 × 607 (16 KB)) - 21:50, 4 February 2023
 DescriptionGdp per capita switzerland usa.gif English: GDP per capita (PPP) Switzerland USA Date 1 August 2008 Source Own work Author Frichmon...(708 × 577 (16 KB)) - 17:49, 2 September 2020
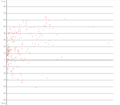 DescriptionLatitude-gdp per capita graph.png Русский: По оси ординат отложены средние широты стран[1], а по оси абсцисс — их ВВП на душу населения.[2]...(1,080 × 944 (14 KB)) - 12:34, 7 July 2021
 DescriptionDaily per capita protein supply vs. GDP per capita, OWID.svg English: :Daily per capita protein supply vs. GDP per capita Daily per capita supply of...(850 × 600 (33 KB)) - 17:21, 26 April 2024
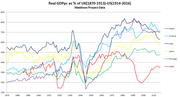 DescriptionUSSR GDP per capita.png Español: PIB per cápita de la URSS en comparación con países similares English: GDP per capita of the USSR compared...(1,076 × 578 (75 KB)) - 08:08, 1 December 2023
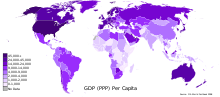 DescriptionGDP PPP Per Capita Worldmap 2008 CIA Factbook.svg English: World map of GDP PPP Per Capita using CIA World Factbook 2008 data Date 9 June 2008...(940 × 415 (1.64 MB)) - 12:52, 6 October 2020
 DescriptionGDP per capita of China and India.svg English: Per capita GDP of China and India, in constant 1990 dollars. Data from Maddison Project Database...(750 × 560 (11 KB)) - 08:01, 6 January 2023
 DescriptionNominal GDP Per Capita MEX 2010.svg English: Map that shows the mexican states by nominal GDP Per Capita in 2010. Español: Mapa que muestra...(1,030 × 690 (480 KB)) - 03:28, 21 August 2020
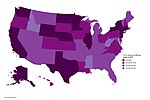 DescriptionU.S.A. states by GDP per capita in 2015.jpg English: U.S.A. states by GDP per capita in 2015 Date 31 March 2017 Source Own work Author Tom224a...(5,400 × 3,585 (1.23 MB)) - 11:04, 4 June 2022
 DescriptionGDP PPP per capita 2007 WB.png World map showing 2007 estimates about GDP (PPP) per capita (international dollars) Date 2 December 2008 Source...(1,500 × 630 (69 KB)) - 06:17, 31 August 2020
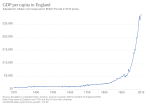 DescriptionGDP per capita in England, OWID.svg English: :GDP per capita in England Adjusted for inflation and measured in British Pounds in 2013 prices...(850 × 600 (10 KB)) - 17:27, 23 April 2024
 DescriptionMedian monthly per capita expenditure vs. GDP per capita, OWID.svg English: :Median monthly per capita expenditure vs. GDP per capita Both metrics are...(850 × 600 (11 KB)) - 13:05, 19 January 2023
 America GDP per capita 1991-2011.png English: GDP PPP per capita of Argentina, Brazil, Chile and Mexico (source), as a percentage of the average GDP PPP per...(773 × 664 (79 KB)) - 22:23, 15 September 2020
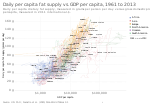 DescriptionDaily per capita fat supply vs. GDP per capita, OWID.svg English: :Daily per capita fat supply vs. GDP per capita Daily per capita supply of fat...(850 × 600 (186 KB)) - 17:21, 26 April 2024
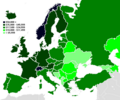 DescriptionEurope-GDP-PPP-per-capita-map-worldbank.png English: Map showing regional variation in European GDP (PPP) per capita in 2012. Figures from...(720 × 600 (92 KB)) - 16:43, 4 November 2022
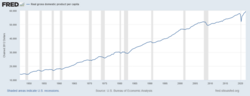 DescriptionUnited States GDP per capita.png English: Real GDP per capita in the United States Date 17 December 2016 Source https://fred.stlouisfed.org/graph/...(1,168 × 450 (55 KB)) - 06:53, 27 February 2023
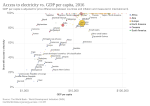 DescriptionAccess to electricity vs. GDP per capita, OWID.svg English: :Access to electricity vs. GDP per capita GDP per capita is adjusted for price differences...(850 × 600 (44 KB)) - 09:51, 12 May 2024
 DescriptionEvolution of GDP per capita in some former Soviet countries.svg English: Evolution of GDP per capita in some former Soviet countries. Figures...(842 × 595 (21 KB)) - 08:06, 21 September 2020
 DescriptionGDP per capita vs national average, %.JPG English: GDP per capita vs national average, % Date 27 January 2010 Source http://www.stat.gov.lt/en/news/view/...(490 × 306 (20 KB)) - 16:05, 27 March 2022
 DescriptionMismanaged plastic waste per capita vs. GDP per capita, OWID.svg English: :Mismanaged plastic waste per capita vs. GDP per capita Mismanaged waste is waste...(850 × 600 (30 KB)) - 15:33, 9 May 2023
 GDP per capita map of Russia.png English: Russian federal subjects by GDP per capita, data from en:List of Russian federal subjects by GDP per capita...(2,000 × 1,212 (95 KB)) - 19:25, 28 August 2020
 DescriptionGDP nominal per capita world map IMF 2008.svg English: Vector version of File:GDP nominal per capita world map IMF 2008.png, but resampled such...(940 × 415 (1.43 MB)) - 07:39, 7 October 2020
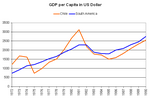 DescriptionGDP per Capita Chile 1972-1990.PNG English: Data from [1] United Nations Statistics Division. GDP per Capita (in US Dollar) at current prices...(637 × 418 (11 KB)) - 14:08, 28 September 2020
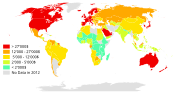 DescriptionCountries by GDP per Capita (PPP, 2012).svg English: Countries by GDP per Capita (PPP) in 2012 Colour sorted by Percentile with Step 20% Date...(863 × 443 (1.67 MB)) - 05:51, 22 April 2024
 DescriptionUS GDP per capita by state 2010 (current dollars).svg English: Map of USA gross state product per capita as of 2010 (current dollars) This...(512 × 240 (64 KB)) - 20:38, 16 October 2021
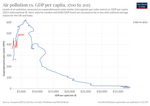 Air pollution vs gdp per capita Title Air pollution vs gdp per capita Description Air pollution vs. GDP per capita, 1700 to 2015. Levels of air pollution...(850 × 600 (72 KB)) - 18:25, 11 May 2024
 File:GDP nominal per capita world map IMF 2008.svg is a vector version of this file. It should be used in place of this PNG file when not inferior. File:GDP...(1,800 × 820 (187 KB)) - 19:23, 18 September 2020
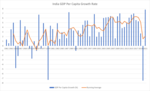 DescriptionIndia GDP Per Capita Growth 1961-2021.png English: World Bank Data: https://data.worldbank.org/indicator/NY.GDP.PCAP.KD.ZG Running Average...(2,932 × 1,778 (177 KB)) - 08:02, 28 August 2023
 DescriptionBiaroch European GDP per capita 1830-1890.svg English: Estimates of GDP per capita (expressed in 1960 US dollars) for European Great Powers...(512 × 320 (11 KB)) - 20:48, 9 January 2024
 by GDP per capita (1939).svg Português: Mapa dos estados brasileiros por PIB per capita (1939). English: Map of Brazilian states by GDP per capita (1939)...(780 × 687 (486 KB)) - 16:24, 18 December 2023
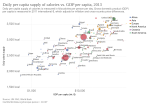 DescriptionDaily per capita supply of calories vs. GDP per capita, OWID.svg English: :Daily per capita supply of calories vs. GDP per capita Daily per capita supply...(850 × 600 (33 KB)) - 17:21, 26 April 2024
 DescriptionUS GDP per capita.svg English: GDP per capita of the United States in constant 2015 dollars. Data from CIA World Factbook Date 3 June 2016 Source...(750 × 560 (97 KB)) - 07:58, 17 November 2023
 DescriptionGDP per capita and GDP growth rate for Brazil, 2003–2013.svg English: GDP per capita and GDP growth rate for Brazil, 2003–2013 Date 1 January...(497 × 271 (4.67 MB)) - 20:48, 9 January 2024
 DescriptionGDP-per-capita West-Africa 2019.jpg English: GDP per capita in West Africa, 2019 Date 17 October 2022 Source Own work Author FrankvEck...(1,908 × 1,011 (520 KB)) - 07:00, 8 August 2023
 DescriptionChile GDP per capita PPP Pinochet.svg English: Chile GDP per capita in constant USD, PPP adjusted, 1950-2008. Pinochet period highlighted....(512 × 317 (3 KB)) - 07:19, 27 February 2024
 DescriptionGreece peripheries GDP per capita.svg English: GDP per capita of the Greek peripheries in 2008. Date 25 October 2011, 15:33 (UTC) Source...(7,304 × 7,315 (1.85 MB)) - 14:39, 29 October 2020
 DescriptionDrowning death rate vs. GDP per capita, OWID.svg English: :Drowning death rate vs. GDP per capita Drowning death rates, measured as the number...(850 × 600 (35 KB)) - 23:14, 11 May 2024
 DescriptionDiabetes-prevalence-vs-gdp-per-capita.png English: Diabetes prevalence v gdp per capita Date Unknown date Unknown date Source https://owidm...(3,400 × 2,400 (642 KB)) - 11:10, 12 April 2024
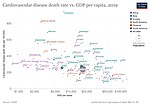 DescriptionCardiovascular-death-rate-vs-gdp-per-capita (1).jpg English: cardiovascular death v gdp per capita Date Unknown date Unknown date Source https://owidm...(3,400 × 2,400 (289 KB)) - 17:05, 23 April 2024
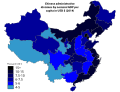 DescriptionChina- Nominal GDP per capita (USD).svg English: Chinese administrative divisions by nominal GDP per capita in 2014. Date 1 October 2015 Source...(914 × 699 (104 KB)) - 13:08, 27 February 2024
 DescriptionTrends in GDP per capita and GDP growth in China, 2003–2014.svg English: Trends in GDP per capita and GDP growth in China, 2003–2014 Română:...(608 × 449 (231 KB)) - 06:51, 27 February 2023
 capita vs gdp per capita Title Energy use per capita vs gdp per capita Description GDP per capita vs. energy use, 2015. Annual energy use per capita,...(850 × 600 (83 KB)) - 17:24, 23 April 2024
 DescriptionGdp per capita 2007 africa map.svg 4,000 and above 2,000-4,000 1,000-2,000 500-1,000 Below 500 N/A English: 2007 figures of GDP (nominal)...(1,000 × 1,000 (190 KB)) - 18:31, 24 September 2020
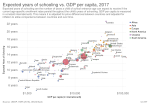 DescriptionExpected years of schooling vs. GDP per capita, OWID.svg English: :Expected years of schooling vs. GDP per capita Expected years of schooling are the...(850 × 600 (36 KB)) - 23:14, 11 May 2024
 DescriptionMap of GDP per capita in the EU in 2007 (NUTS 3).png English: A map of Europe divided into countries; where EU member states are further divided...(3,546 × 3,524 (2.47 MB)) - 17:42, 13 September 2020
 File:Average GDP PPP per capita.svg is a vector version of this file. It should be used in place of this PNG file when not inferior. File:Average GDP PPP per...(1,350 × 625 (48 KB)) - 05:42, 6 October 2023
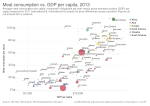 DescriptionMeat consumption vs. GDP per capita, OWID.svg English: :Meat consumption vs. GDP per capita Average meat consumption per capita, measured in kilograms...(850 × 600 (33 KB)) - 07:00, 4 November 2022
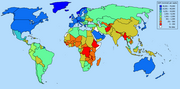 DescriptionGDP nominal per capita world map IMF figures for year 2004.png GDP (nominal) per capita. Using wikipedia's world map and information from IMF...(2,250 × 1,117 (170 KB)) - 19:43, 8 October 2020
 DescriptionAnnual growth of GDP per capita, OWID.svg English: :Annual growth of GDP per capita Annual percentage growth rate of GDP per capita based on constant...(850 × 600 (140 KB)) - 13:01, 11 May 2024
 DescriptionGDP per Capita of the United States-semilog.svg English: Semi-log plot of GDP per capita of the United States from 1800 to 2010 in constant...(800 × 600 (14 KB)) - 08:05, 11 September 2020
 DescriptionMap of GDP per capita in the EU in 2007 (NUTS 3).svg English: A map of Europe divided into countries; where EU member states are further divided...(762 × 757 (4.29 MB)) - 08:12, 16 September 2020
 DescriptionCO₂ emissions and GDP per capita, OWID.svg English: :CO₂ emissions and GDP per capita Annual consumption-based emissions are domestic emissions...(850 × 600 (9 KB)) - 17:18, 23 April 2024
 DescriptionDietary land use vs. GDP per capita, OWID.svg English: :Dietary land use vs. GDP per capita The share of global habitable land which would...(850 × 600 (34 KB)) - 19:49, 7 May 2024
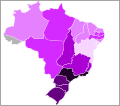 by GDP per capita (1950).svg Português: Mapa dos estados brasileiros por PIB per capita (1950). English: Map of Brazilian states by GDP per capita (1950)...(780 × 687 (486 KB)) - 16:24, 18 December 2023
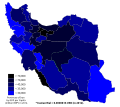 DescriptionProvinces of Iran by GDP per capita.svg English: Provinces of Iran by GDP per capita in 2012, based on data from here. Date 7 September 2015...(900 × 800 (360 KB)) - 20:31, 13 June 2023
 expenditure spent on food vs. GDP per capita, OWID.svg English: :Share of consumer expenditure spent on food vs. GDP per capita Food expenditure relates only...(850 × 600 (20 KB)) - 12:47, 28 August 2023
 States by GDP per capita 2006.svg English: Map of Brazilian states by GDP per capita. Português: Mapa dos estados brasileiros por PIB per capita. DGP per...(780 × 687 (638 KB)) - 16:24, 18 December 2023
 DescriptionIndian states by GDP per capita 2013-14.png English: Indian states by GDP per capita 2013-14 Red - < 50,000 Rs Orange - 50,000 to 75,000 Rs...(1,486 × 1,734 (265 KB)) - 05:07, 10 April 2023
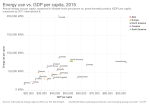 DescriptionEnergy use vs. GDP per capita, OWID.svg English: :Energy use vs. GDP per capita Annual energy use per capita, measured in kilowatt-hours per...(850 × 600 (13 KB)) - 17:24, 23 April 2024
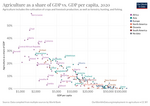 of gdp vs gdp per capita Title Value added in the agricultural sector as of gdp vs gdp per capita Description Agriculture as a share of GDP vs. GDP per...(850 × 600 (90 KB)) - 12:46, 11 August 2023
 DescriptionChild mortality vs GDP per capita, OWID.svg English: :Child mortality vs GDP per capita Child mortality is defined as the number of children...(850 × 600 (36 KB)) - 17:05, 23 April 2024
 DescriptionUrban population vs. GDP per capita, OWID.svg English: :Urban population vs. GDP per capita Share of the total population living in urban...(850 × 600 (33 KB)) - 02:34, 4 November 2022
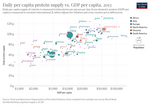 capita protein supply vs gdp per capita Title Daily per capita protein supply vs gdp per capita Description Daily per capita protein supply vs. GDP per...(850 × 600 (103 KB)) - 17:21, 26 April 2024
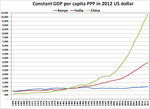 DescriptionKenya's GDP per capita since independence.png English: Kenya's GDP per capita since independence Date 28 December 2011 Source Own work Author...(912 × 662 (37 KB)) - 00:40, 12 September 2020
 DescriptionGDP Per Capita North Balkan Region.svg English: This data is expressed in 2015 US$. It is adjusted for inflation but does not account for differences...(850 × 600 (35 KB)) - 14:13, 4 August 2023
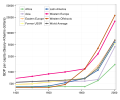 DescriptionHistoric world GDP per capita.svg English: Breaks down GDP per capita per Area from 1400 to 2003. Vector version of this figure, built using...(540 × 450 (93 KB)) - 15:56, 29 September 2023
- am from Poland (Central Europe), which is a well doing country now (GDP per capita 4x bigger than that of Ukraine, 4x smaller than that of France), but...763 bytes (133 words) - 07:30, 20 May 2015
 DescriptionIraq GDP per capita 1950-2008.png English: Iraq GDP per capita 1950-2008. Source: Angus Maddison, February 2010 Date 18 July 2010 Source Own...(310 × 237 (6 KB)) - 03:15, 9 September 2020
 DescriptionCardiovascular-death-rate-vs-gdp-per-capita.png English: cardiovascular death rate v gdp per capita Date Unknown date Unknown date Source https://owidm...(3,400 × 2,400 (629 KB)) - 17:05, 23 April 2024
 DescriptionChina vs World by Nominal GDP per capita in 2019.jpg English: China vs World by Nominal GDP per capita in 2019 ( Date 6 January 2019 Source...(6,276 × 3,217 (2.8 MB)) - 22:08, 28 February 2024
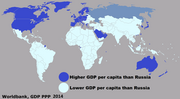 DescriptionGDP per capita than Russia 2014.png English: Based on the World Bank figures. If no number was available for a country from IMF, CIA figures...(1,350 × 739 (47 KB)) - 08:52, 26 April 2021
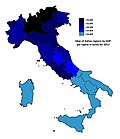 DescriptionMap of Italian regions by GDP per capita in euros (2015).jpg English: Map of Italian regions by GDP per capita in euros (2015). Date 25 November...(2,000 × 2,313 (799 KB)) - 08:22, 11 November 2022
 DescriptionGDP per capita big four Western Europe.PNG English: GDP per capita big four Western Europe Date 17 February 2011 Source Own work Author Frichmon...(911 × 623 (38 KB)) - 19:11, 2 September 2023
 DescriptionNorth Korean GDP per capita 1950-2016.jpg English: North Korean GDP per capita 1950-2016 in Geary-Khamis dollars Date 7 May 2018 Source Own...(1,541 × 781 (207 KB)) - 19:16, 6 October 2020
 States by GDP per capita.svg is a vector version of this file. It should be used in place of this PNG file. File:Brazilian States by GDP per capita.PNG →...(528 × 391 (13 KB)) - 16:24, 18 December 2023
 DescriptionGDP per capita of Argentina, percent of US (1900-2008).png English: Argentina's GDP per capita (in 1990 international Geary–Khamis dollar) as...(997 × 697 (105 KB)) - 13:39, 6 September 2021
 DescriptionFruit consumption vs. GDP per capita, OWID.svg English: :Fruit consumption vs. GDP per capita Average per capita fruit consumption, measured in...(850 × 600 (33 KB)) - 11:25, 4 November 2022
 DescriptionGDP per capita vs. economic inequality, OWID.svg English: :GDP per capita vs. economic inequality GDP per capita is adjusted for price differences...(850 × 600 (28 KB)) - 17:28, 23 April 2024

.PNG)
.png)


_Per_Capita_Around_the_World_2023.png)
.png)
_2015.png)


.svg)


.svg)


.svg)


.png)


_per_capita_in_2019.png)


.jpg)


.png)


.png)
_per_capita_in_2017.png)

.png)

.png)


.png)
,_2011-2021_(HY).png)

_1820-1890_Brazil,_Chile,_Argentina,_Mexico,_US.svg)

_per_capita_in_2022.svg)

_per_capita_in_2020.png)
_in_countries_of_the_region_during_the_COVID-19_pandemic_(HY).jpg)


_per_capita_in_2020.png)
_per_capita_in_2024.svg)
.svg)
.png)


_per_capita_in_2019.svg)


_per_capita_according_to_latest_available_data.png)

.png)


_per_capita_map_of_the_Arab_League_(October_2023_IMF_data).svg)


_per_capita_in_2021.svg)


_per_capita_in_2018.png)

.png)


_1820-1890_Brazil,_Chile,_Argentina,_Mexico,_US_-_PT.svg)


_per_capita_in_2022_by_IMF.png)


_per_capita_in_2020_(new).png)
.png)


_per_capita_in_2022_by_IMF_v2.png)


_2014.png)


_2011.png)


_per_capita_map.png)


.png)

.png)


.svg)


_per_capita,_2012_IMF.jpg)


_vs_GDP_per_capita,_OWID.svg)


.png)


.png)


.png)


.png)


.svg)
.svg)
.png)


.svg)


.jpg)
.svg)

.png)


.png)


.svg)


.svg)


.png)


.png)


.jpg)


.png)

