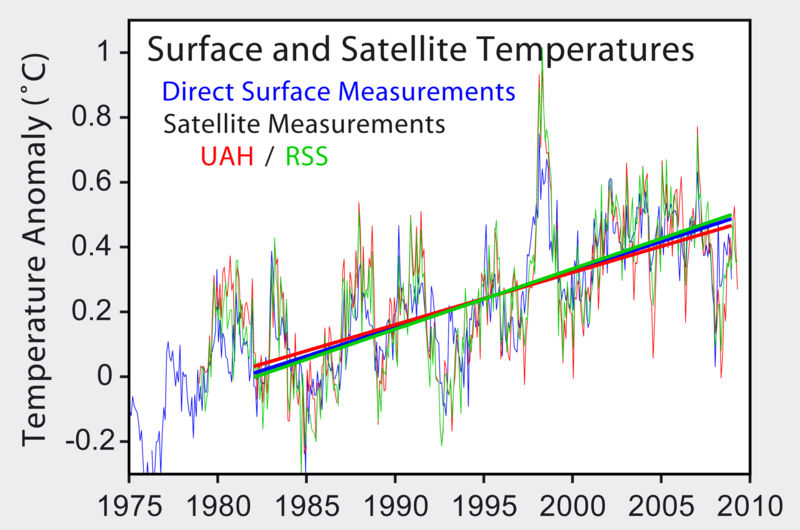
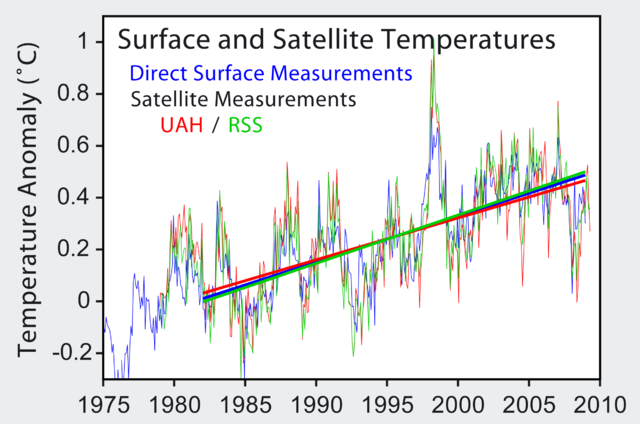
File:Satellite Temperatures.png

Page contents not supported in other languages.
This is a file from the Wikimedia Commons
From Wikipedia, the free encyclopedia

Original file(2,400 × 1,590 pixels, file size: 297 KB, MIME type: image/png)

Description
The last 25 years of surface measurements with various averages and a comparison to El Niño and volcanic forcing.
The surface temperature record extended back to 1880.
(UAH 2003; data set tltglhmam version 5.2 with 2009 updates) and Schabel et al. (RSS 2002; data set tlt_land_and_ocean with 2009 updates). These two satellite records reflect two different ways of interpreting the same set of microwave sounder measurements and are not independent records. Each record is plotted as the monthly average and straight lines are fit through each data set from January 1982 to December 2009. The slope of these lines are 0.187°C/decade, 0.163°C/decade, and 0.239°C/decade for the surface, UAH, and RSS respectively. The 5.2 version of Christy et al.'s satellite temperature record contains a significant correction over previous versions. In summer 2005, Mears and Wentz (2005) discovered that the UAH processing algorithms were incorrectly adjusting for diurnal variations, especially at low latitude. This correction raised the trend line 0.035°C/decade, and in so doing brought it into much better agreement with the ground based records and with independent satellite based analysis (e.g. Fu et al. 2004). The discovery of this error also explains why their satellite based temperature trends had disagreed most prominently in the tropics. Within measurement error, all of these records paint a similar picture of temperature change and global warming. However, climate models predict carbon dioxide based greenhouse warming should result in lower atmosphere warming roughly 1.3 times higher than the surface warming. This prediction is consistent with the RSS vs. surface comparison, though by contrast the UAH vs. surface comparison suggests a troposphere warming by slightly less than the surface of the Earth. Note: In the above figure, there is still a significant discrepancy between the very earliest satellite measurements and the ground based measurements at that time. For this reason only the interval 1982-2005 was used in calculating each trend. Including the earliest years leads to a wider dispersion , with trends of 0.170°C/decade, 0.116°C/decade, and 0.192°C/decade for the surface, UAH, and RSS data respectively. The origin of this discrepancy is unclear. This figure was prepared by Robert A. Rohde from publicly available data and is incorporated into the Global Warming Art project.
  • Jones, P.D. and Moberg, A. (2003). "Hemispheric and large-scale surface air temperature variations: An extensive revision and an update to 2001". Journal of Climate 16: 206-223.
  • Christy, J.R., R.W. Spencer, W.B. Norris, W.D. Braswell and D.E. Parker (2003). "Error estimates of version 5.0 of MSU/AMSU bulk atmospheric temperatures". J. Atmos. Oceanic Technol. 20: 613-629.
  • Fu, Q., Johanson, C. M., Warren, S. G. & Seidel, D. J. (2004). "Contribution of stratospheric cooling to satellite-inferred tropospheric temperature trends". Nature 429: 55−58.
  • Mears, Carl A. and Frank J. Wentz (2005). "The Effect of Diurnal Correction on Satellite-Derived Lower Tropospheric Temperature". Science Express: published online 11 August 2005.
  • Matthias C. Schabel, Carl A. Mears, Frank J. Wentz (2002). "Stable Long-Term Retrieval of Tropospheric Temperature Time Series from the Microwave Sounding Unit". Proceedings of the International Geophysics and Remote Sensing Symposium III: 1845-1847.
Source http://www.cru.uea.ac.uk/cru/data/temperature/
Author Robert A. Rohde

Summary ==

Image from Global Warming Art
This image is an original work created for Global Warming Art. Please refer to the image description page for more information.
GNU head Permission is granted to copy, distribute and/or modify this document under the terms of the GNU Free Documentation License, Version 1.2 or any later version published by the Free Software Foundation; with no Invariant Sections, no Front-Cover Texts, and no Back-Cover Texts. A copy of the license is included in the section entitled GNU Free Documentation License.
w:en:Creative Commons
attribution share alike
This file is licensed under the Creative Commons Attribution-Share Alike 3.0 Unported license.
You are free:
  • to share – to copy, distribute and transmit the work
  • to remix – to adapt the work
Under the following conditions:
  • attribution – You must give appropriate credit, provide a link to the license, and indicate if changes were made. You may do so in any reasonable manner, but not in any way that suggests the licensor endorses you or your use.
  • share alike – If you remix, transform, or build upon the material, you must distribute your contributions under the same or compatible license as the original.
This licensing tag was added to this file as part of the GFDL licensing update.

Captions

Add a one-line explanation of what this file represents

Items portrayed in this file

depicts

image/png

File history

Click on a date/time to view the file as it appeared at that time.

Date/TimeThumbnailDimensionsUserComment
current20:30, 31 July 2009Thumbnail for version as of 20:30, 31 July 20092,400 × 1,590 (297 KB)Dragons flightupdate
07:10, 10 April 2006Thumbnail for version as of 07:10, 10 April 2006512 × 363 (30 KB)Pflatau

Global file usage